Nearly 90% of U.S. Census Tracts Sit on Flat Land
See more of our coverage in your search results.
America pictures itself as a land of mountains, but the ground most Americans stand on is flat. A newly updated federal dataset puts a precise number on it: about nine in ten U.S. census tracts sit on land that is level or nearly level. The USDA Economic Research Service has refreshed its Area Ruggedness Scale for the 2020 census tracts, and the picture it draws is of a mostly flat country with its rugged terrain packed into a few well-known mountain systems.
The Area Ruggedness Scale, or ARS, sorts every census tract onto a six-step ordinal scale, from level to extremely rugged, based on the average change in elevation across the tract. Census tracts are the small, neighborhood-sized areas the U.S. Census Bureau uses to organize its data, which makes the ARS a rare way to attach a terrain reading to the same geography that carries income, population, and housing statistics.
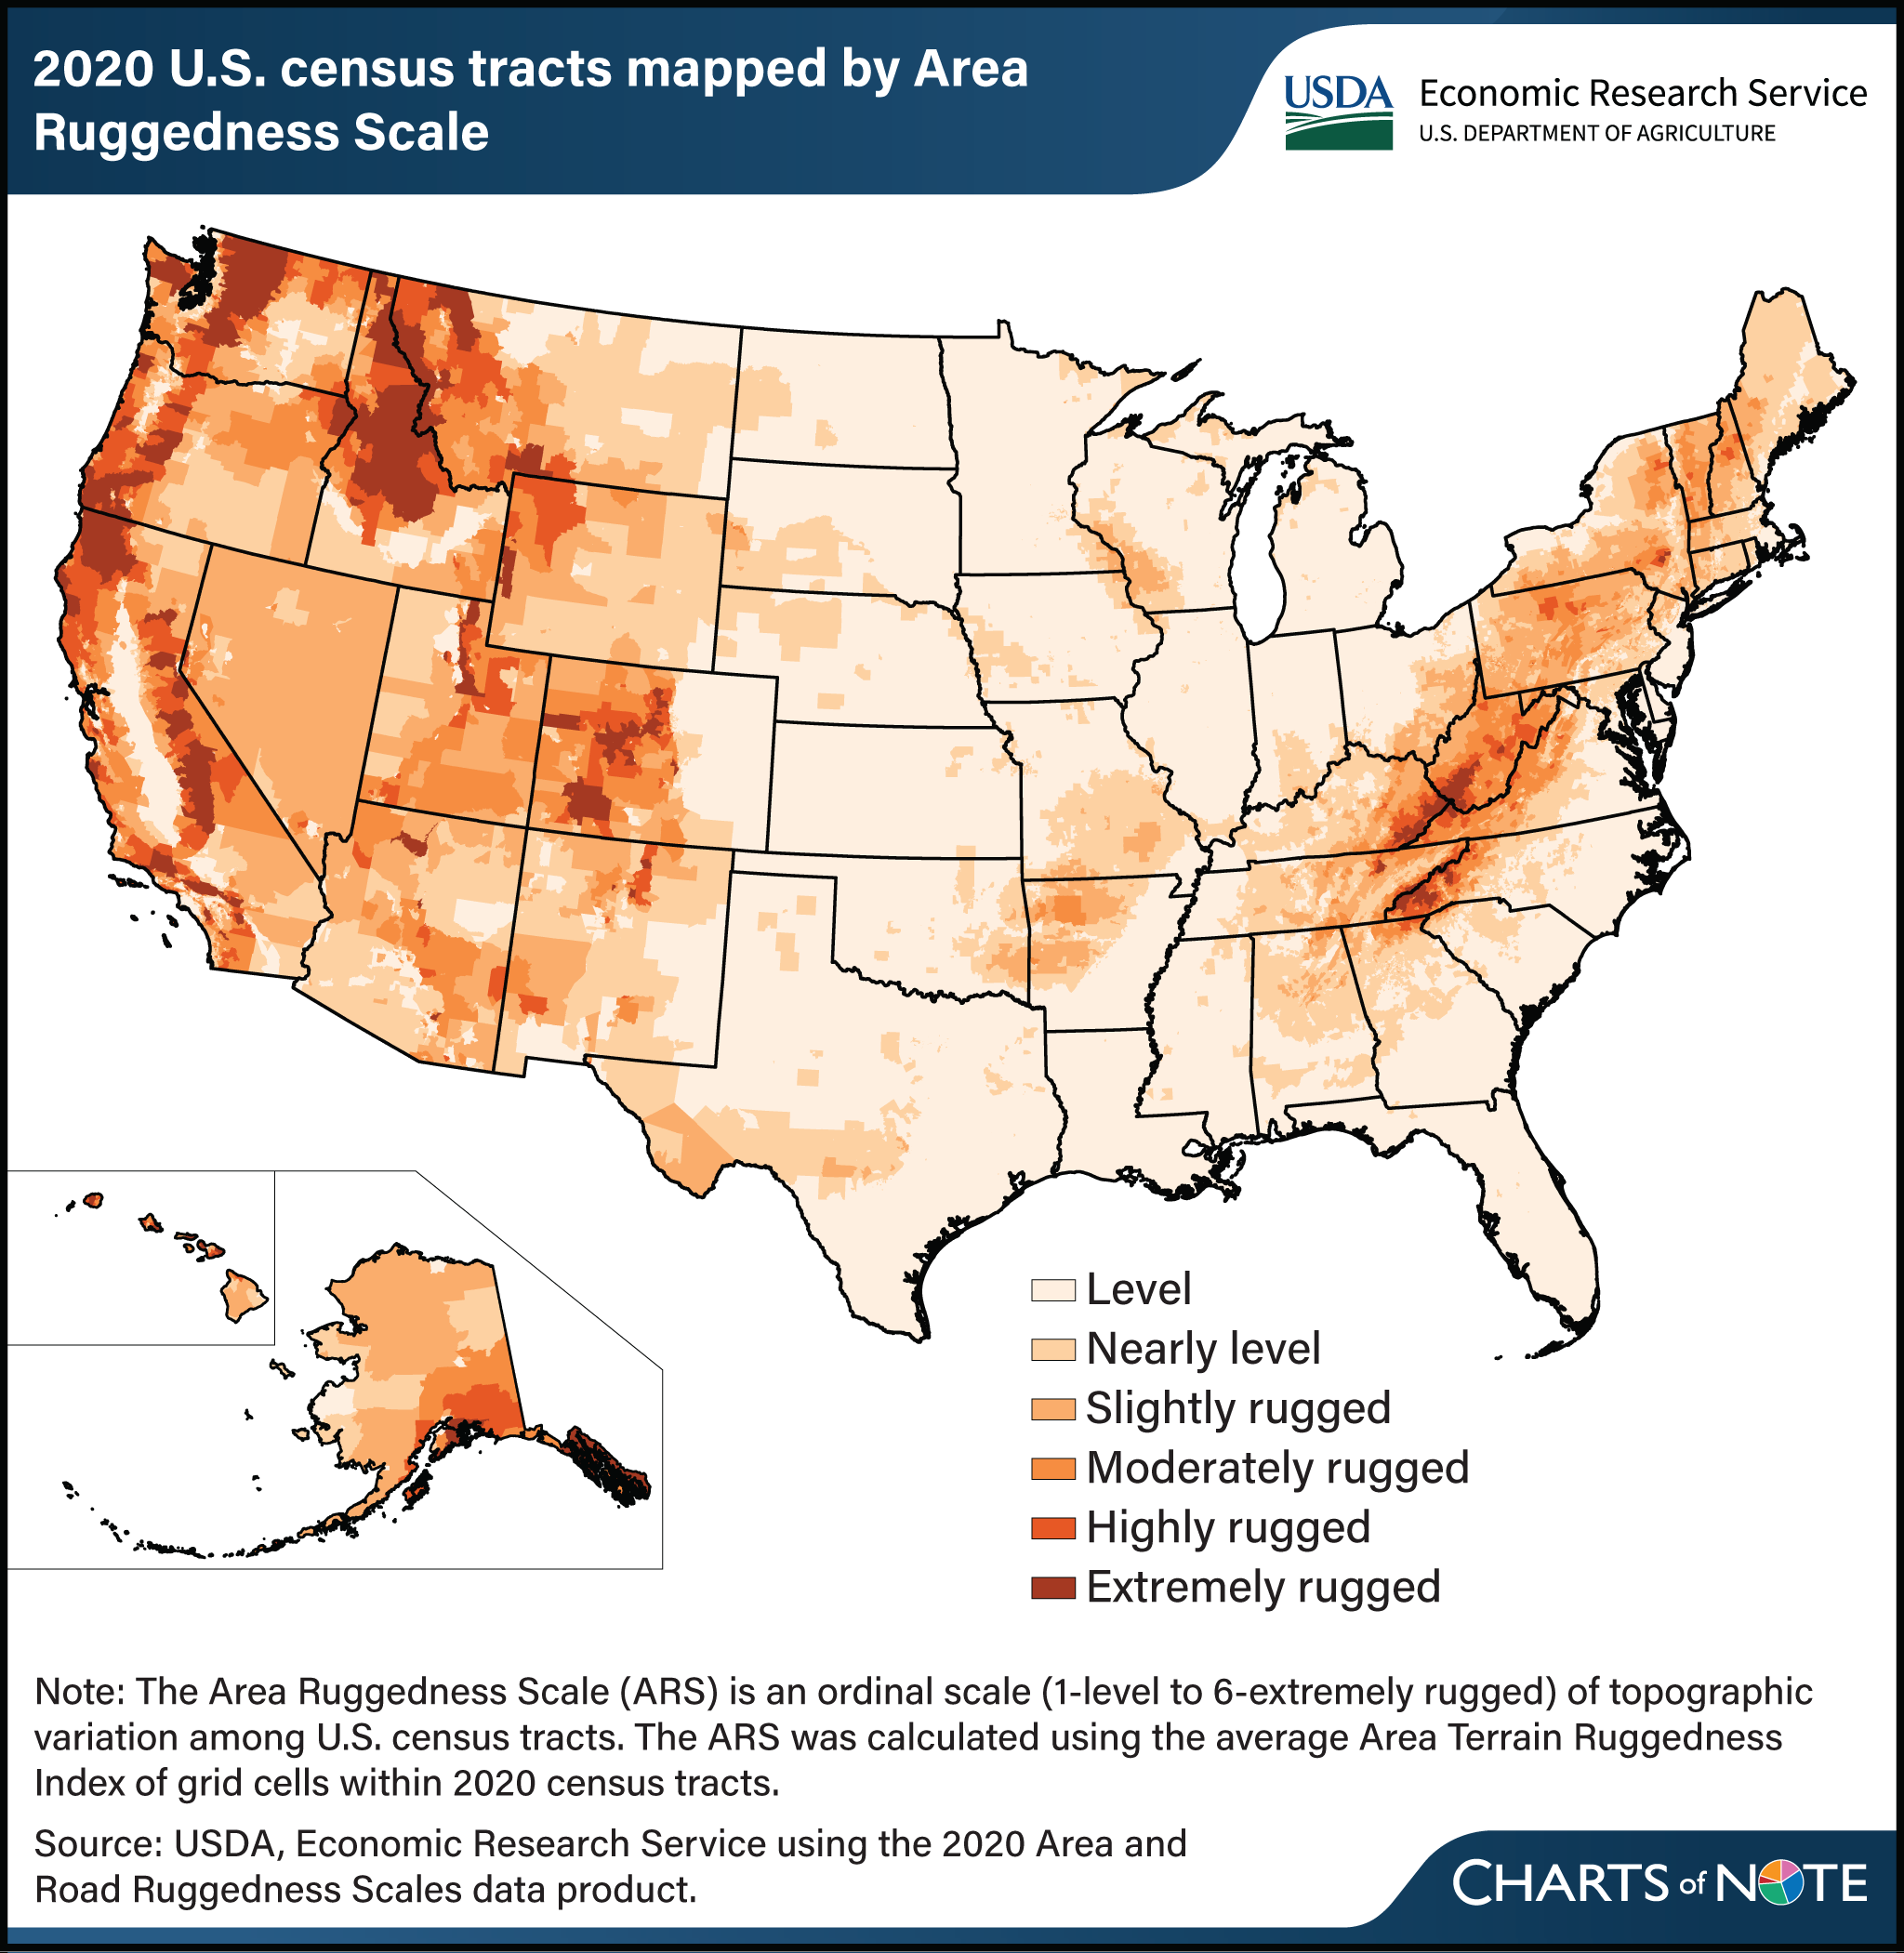
Most of the country barely tilts
| Tier | Ruggedness category | Share of census tracts |
|---|---|---|
| 1 | Level | 70.8% |
| 2 | Nearly level | 19.6% |
| 3-5 | Slightly to highly rugged | 9.1% |
| 6 | Extremely rugged | 0.5% |
Level tracts alone make up 70.8 percent of the country, and nearly level tracts add another 19.6 percent. That leaves just 9.6 percent of census tracts classified as at least slightly rugged, and only one in every two hundred, 0.5 percent, ranking as extremely rugged. The flat share dominates because it includes the places where Americans actually cluster: the coastal plains, the Midwest, the Gulf and Atlantic lowlands, and the river valleys where cities grew up.
The rugged tracts trace the mountains exactly
The small rugged minority is not scattered at random. It draws the mountain map of the United States: the Appalachians running from Georgia up through West Virginia and into New England, the Rockies, the Sierra Nevada along California's spine, and the Ozarks of Missouri and Arkansas. On the ERS map these ranges glow in deep orange against an otherwise pale country, a reminder that ruggedness in America is a regional story, not a national one.
Terrain like that cuts both ways for the people who live near it. Steep, broken ground has always been an obstacle to building, farming, and travel, which is part of why the most rugged tracts are also among the most sparsely settled. But the same mountains that keep population thin pull in tourists, second-home buyers, and residents who move specifically for the hiking, skiing, and scenery. It is the tension we found running through the fast-changing mountain towns in our look at the fastest-gentrifying cities in America, where places like Bozeman and Bend built whole economies on rugged surroundings.
Why terrain belongs next to the census data
ERS built the ruggedness scale to support research on how geography shapes the well-being of communities, especially rural ones, where terrain can determine access to jobs, hospitals, and broadband as directly as any policy. Pairing a ruggedness reading with the demographic profile of the same tract lets researchers ask whether rugged places are older, poorer, or harder to reach, and by how much.
That is the same tract-level lens CensusEasy is built on. You can explore the country tract by tract on our interactive map, which lets you sweep the same 2020 boundaries back through earlier decades, read what the geography reveals in exploring America by census tract, or see the demographic outliers in the most extreme census tracts in America. For a plain-English primer on what a tract is in the first place, start with what census terms actually mean.
Sources
Ruggedness figures and the national map are from the USDA Economic Research Service, drawn from its Area and Road Ruggedness Scales data product and its Charts of Note feature on the 2020 update. Census tract boundaries are defined by the U.S. Census Bureau.
Add CensusEasy as a preferred source on Google to see our stories first.
 GENERAL
Black household income rises 76% since 1967, but dollar gap with White households widens
Census figures back to 1967 show Black median household income up 76.2 percent after inflation, to $59,980. The ratio to non-Hispanic White income narrowed, but the gap in dollars grew to $36,730.
 GENERAL
These U.S. counties have the highest housing vacancy rates, but they're not abandoned
Sixty-one percent of housing in Summit County, Colorado is vacant. That's Breckenridge, not a ghost town. Every county at the top of the vacancy list is a vacation destination.
 GENERAL
The area codes with the most people
Hawaii's 808 is the most populous area code covering a whole state, with 1.43 million residents. Arizona averages 1.5 million people per code. Here is every state's area codes and residents per code.
What share of U.S. census tracts are on flat land?
About 90 percent. According to the USDA Economic Research Service Area Ruggedness Scale, 70.8 percent of census tracts are classified as level and another 19.6 percent as nearly level. Only 9.6 percent are at least slightly rugged, and just 0.5 percent are extremely rugged.
What is the Area Ruggedness Scale?
The Area Ruggedness Scale (ARS) is a USDA Economic Research Service dataset that ranks each U.S. census tract on a six-step ordinal scale, from level to extremely rugged, based on the average change in elevation across the tract. The 2020 update matches the scale to the most recent census tract boundaries.
Where are the most rugged census tracts?
The most rugged census tracts follow the country's major mountain systems: the Appalachians from Georgia through New England, the Rockies, the Sierra Nevada in California, and the Ozarks of Missouri and Arkansas. These areas tend to be sparsely populated but attract tourism and outdoor recreation.