
The US counties that diversified most since 2000
Forsyth County, Georgia, went from 92% white in 2000 to 62% white today, the biggest shift among the 613 US counties with 100,000 or more people. Georgia and Pennsylvania each have four counties in the top 25.
See more of our coverage in your search results.
In 2000, Forsyth County, Georgia was 92.3% non-Hispanic white. In the 2020-2024 American Community Survey it is 61.8% white, 19.6% Asian, and 10.1% Hispanic. On the CensusEasy diversity score, a 0 to 100 scale where 100 means five racial and ethnic groups of equal size, the county went from 18.1 to 70.7. That is the largest gain among the 613 US counties with at least 100,000 residents.
The score is a Simpson diversity index: the probability that two residents picked at random belong to different groups, using five categories (non-Hispanic white, Black, Hispanic, Asian, and everyone else). A county that is 96% one group scores around 10. Queens County, New York, the most diverse large county in the country, scores 96.2.
The 25 counties that diversified most, 2000 to 2024
Of the 613 counties, 587 became more diverse and 26 became less diverse. The median county gained 17.2 points. Georgia has four of the top 25, Pennsylvania has four, and Arkansas, Minnesota, and Virginia have two each. Every county in the top 25 was at least 76% white in 2000. None is above 80% white now.
| Rank | County | 2000 | 2024 | Change | White share | Hispanic | Black | Asian |
|---|---|---|---|---|---|---|---|---|
| 1 | Forsyth County, GA | 18.1 | 70.7 | +52.6 | 92.3% to 61.8% | 10.1% | 4.2% | 19.6% |
| 2 | Paulding County, GA | 24.0 | 70.4 | +46.4 | 89.6% to 61.0% | 8.7% | 23.1% | 1.5% |
| 3 | Kendall County, IL | 24.7 | 69.5 | +44.8 | 89.2% to 62.0% | 22.4% | 7.6% | 3.5% |
| 4 | Benton County, AR | 29.8 | 74.6 | +44.8 | 86.8% to 58.0% | 18.5% | 1.8% | 4.6% |
| 5 | Luzerne County, PA | 9.7 | 52.1 | +42.4 | 96.0% to 74.2% | 17.3% | 4.1% | 1.2% |
| 6 | Stafford County, VA | 42.8 | 82.6 | +39.8 | 80.1% to 51.5% | 16.6% | 19.5% | 3.9% |
| 7 | Frederick County, MD | 27.4 | 66.9 | +39.5 | 88.1% to 65.7% | 12.9% | 10.1% | 5.9% |
| 8 | Pasco County, FL | 23.4 | 62.8 | +39.4 | 89.9% to 67.5% | 18.6% | 6.0% | 3.4% |
| 9 | Hendricks County, IN | 9.6 | 48.4 | +38.8 | 96.0% to 77.3% | 5.2% | 10.0% | 3.3% |
| 10 | Loudoun County, VA | 44.4 | 83.0 | +38.6 | 79.6% to 51.0% | 14.3% | 7.5% | 21.7% |
| 11 | Monroe County, PA | 34.1 | 72.6 | +38.5 | 84.8% to 60.4% | 18.2% | 13.0% | 2.6% |
| 12 | Washington County, AR | 34.5 | 72.4 | +37.9 | 84.6% to 59.9% | 18.6% | 3.0% | 2.4% |
| 13 | DeSoto County, MS | 33.6 | 71.3 | +37.7 | 84.7% to 56.4% | 5.8% | 32.6% | 1.3% |
| 14 | Fayette County, GA | 39.2 | 76.8 | +37.6 | 82.0% to 55.5% | 8.6% | 25.3% | 4.9% |
| 15 | Anoka County, MN | 17.2 | 53.5 | +36.3 | 92.8% to 74.5% | 5.8% | 8.8% | 5.6% |
| 16 | Cabarrus County, NC | 41.0 | 76.8 | +35.8 | 80.9% to 57.3% | 12.7% | 18.7% | 6.2% |
| 17 | Henry County, GA | 42.1 | 77.8 | +35.7 | 80.1% to 32.4% | 8.3% | 51.2% | 3.3% |
| 18 | Norfolk County, MA | 27.8 | 62.5 | +34.7 | 87.9% to 68.7% | 5.8% | 7.1% | 12.4% |
| 19 | Rutherford County, TN | 34.5 | 69.1 | +34.6 | 84.5% to 63.7% | 12.2% | 14.7% | 3.6% |
| 20 | Snohomish County, WA | 37.2 | 71.7 | +34.5 | 83.4% to 62.0% | 12.1% | 3.6% | 13.6% |
| 21 | Collin County, TX | 50.4 | 84.9 | +34.5 | 76.1% to 49.6% | 16.1% | 10.8% | 18.7% |
| 22 | Warren County, NJ | 18.6 | 52.6 | +34.0 | 92.2% to 74.6% | 13.0% | 5.6% | 3.0% |
| 23 | Lackawanna County, PA | 10.0 | 44.0 | +34.0 | 95.9% to 79.6% | 9.8% | 3.0% | 3.0% |
| 24 | Lehigh County, PA | 36.9 | 70.8 | +33.9 | 83.2% to 59.1% | 28.0% | 5.9% | 3.5% |
| 25 | Scott County, MN | 18.0 | 51.7 | +33.7 | 92.4% to 75.6% | 6.4% | 6.1% | 6.3% |
The counties near the top share a pattern. They were outer suburbs or small metros in 2000, and most of them roughly doubled in population since. Forsyth grew from 98,407 people to 282,805. Paulding County, on the west side of metro Atlanta, went from 81,678 to 190,996, and its Black share rose from 6.9% to 23.1%. Kendall County, Illinois, southwest of Chicago, went from 54,544 to 145,470 and is now 22.4% Hispanic. Loudoun County, Virginia more than doubled to 449,749 and is now 21.7% Asian.
The exceptions are the Pennsylvania counties. Luzerne County, which includes Wilkes-Barre and Hazleton, added about 13,000 people in 25 years and went from 96.0% white to 74.2%. Its Hispanic share went from 1.2% to 17.3%. Lackawanna County next door, home to Scranton, grew by about 3,000 people over the same period and went from 95.9% white to 79.6%. In those counties the change came from who moved in, not from how many.
Where the change is Black, Asian, or Hispanic
The group driving the change differs by region. In the four Georgia counties and in DeSoto County, Mississippi, outside Memphis, it is mostly Black residents. Henry County, Georgia went from 14.6% Black in 2000 to 51.2% in 2024, and its white share fell from 80.1% to 32.4%. In Loudoun, Collin County, Texas, and Forsyth, it is Asian residents: 21.7%, 18.7%, and 19.6% respectively in 2024, from 5.3%, 6.9%, and 0.8% in 2000. In the Pennsylvania, Arkansas, Illinois, and Florida counties it is Hispanic residents. Lehigh County, Pennsylvania is 28.0% Hispanic, up from 10.2%.
The national figures over the same period: the non-Hispanic white share of the US population went from 69.1% to 57.4%, the Hispanic share from 12.5% to 19.3%, the Asian share from 3.6% to 5.9%, and the Black share stayed near 12%. In 2000, 547 of the 613 large counties had a white majority. Sixty-nine of those have lost it since.
The 10 counties that became less diverse
Twenty-six counties moved the other way. In most of them one group was already the largest in 2000 and kept growing until it dominated the mix. On this index a county that goes from 57% Hispanic to 69% Hispanic scores lower, because two random residents are now more likely to belong to the same group.
| Rank | County | 2000 | 2024 | Change | Largest group, 2000 to 2024 |
|---|---|---|---|---|---|
| 1 | Imperial County, CA | 54.4 | 31.5 | -22.9 | Hispanic 72.2% to 86.0% |
| 2 | Clayton County, GA | 76.1 | 62.4 | -13.7 | Black 51.1% to 68.5% |
| 3 | Miami-Dade County, FL | 74.0 | 60.4 | -13.6 | Hispanic 57.3% to 69.3% |
| 4 | Merced County, CA | 77.8 | 67.2 | -10.6 | Hispanic 45.3% to 63.4% |
| 5 | Tulare County, CA | 70.7 | 61.1 | -9.6 | Hispanic 50.8% to 66.6% |
| 6 | Cameron County, TX | 33.4 | 24.4 | -9.0 | Hispanic 84.3% to 89.3% |
| 7 | Sumter County, FL | 45.5 | 36.5 | -9.0 | White 78.4% to 83.6% |
| 8 | Monterey County, CA | 76.6 | 67.9 | -8.7 | Hispanic 46.8% to 61.6% |
| 9 | Hinds County, MS | 61.6 | 54.0 | -7.6 | Black 60.9% to 71.7% |
| 10 | Hidalgo County, TX | 26.1 | 18.9 | -7.2 | Hispanic 88.3% to 91.9% |
Clayton County, Georgia, south of Atlanta, is the one county on this list where the largest group is Black: 51.1% in 2000 and 68.5% now. The other nine are either Hispanic-majority counties along the Texas and California borders and in the Central Valley, or in the case of Sumter County, Florida, home to The Villages, a county that got whiter as it grew.
Gwinnett, Osceola, and Prince William
Three counties CensusEasy has written about before sit lower on this list than readers might expect, because their big shifts happened before 2000. Gwinnett County, Georgia ranks 52nd for change since 2000, from 64.6 to 94.1, but its 2024 score is the fourth highest of any large county in the country, behind Queens, Fort Bend County, Texas, and Solano County, California. Gwinnett was 67.0% white in 2000 and is 30.6% white now, with Black, Hispanic, and Asian shares of 27.8%, 23.7%, and 13.2%. Prince William County, Virginia ranks 102nd for change and 12th for its 2024 score of 92.0. Osceola County, Florida gained only 5.9 points because it went from 29.4% Hispanic to 56.0% Hispanic; the county became majority Hispanic, which on this index counts as one group replacing another rather than as more mixing.
That last case is the limit of the score. It measures how evenly a county's population is split across five groups, not how much the county has changed. A county that goes from all one group to all another group would score the same at both ends. The county pages linked in the tables carry the full breakdown for each year, so the change in any one group can be read directly.
Add CensusEasy as a preferred source on Google to see our work first.
Which US county has diversified the most since 2000?
Among counties with at least 100,000 residents, Forsyth County, Georgia. Its diversity score rose from 18.1 in 2000 to 70.7 in 2024 as the non-Hispanic white share fell from 92.3% to 61.8% and the Asian share rose from 0.8% to 19.6%.
How is the diversity score calculated?
It is a Simpson diversity index over five groups: non-Hispanic white, Black, Hispanic, Asian, and everyone else. It equals the chance that two random residents belong to different groups, rescaled so that five equal groups score 100 and a single group scores 0.
Why did some counties become less diverse?
In 26 counties one group that was already the largest in 2000 grew to dominate the population. Imperial County, California went from 72% Hispanic to 86% Hispanic, and Clayton County, Georgia from 51% Black to 69% Black. The index falls when one group's share rises past the others.
The CensusEasy diversity score is a Simpson diversity index over five mutually exclusive groups: non-Hispanic white alone, Black alone, Hispanic or Latino of any race, Asian alone, and a remainder made up of everyone else (American Indian and Alaska Native, Native Hawaiian and Pacific Islander, some other race, and two or more races). For each county and year the index is 1 minus the sum of the squared group shares, then divided by 0.8 (the maximum possible with five groups) and multiplied by 100. A score of 0 means everyone belongs to one group; 100 means five equal groups. The remainder share is computed as 100 minus the four named shares, so the same definition is applied to both years. The 2000 figures are from the 2000 Census (SF1), and the 2024 figures are from the 2020-2024 American Community Survey 5-year estimates, both as stored in the CensusEasy database. The ranking covers the 613 counties and county equivalents with a 2025 population estimate of at least 100,000. Population figures in the text are the 2000 Census count and the Census Bureau's Vintage 2025 estimate. The comparison starts at 2000 rather than 1990 because 2000 is the first decennial census with the same five-group breakdown at every county and the same one-race definitions used in the ACS.
You may cite or republish these findings, and the downloadable dataset is licensed under CC BY 4.0. Reuse requires that you credit CensusEasy and link back to this page so readers can verify the underlying data.
CensusEasy Data Team (2026). "The US counties that diversified most since 2000." CensusEasy. Retrieved from https://censuseasy.com/studies/us-counties-that-diversified-most-since-2000
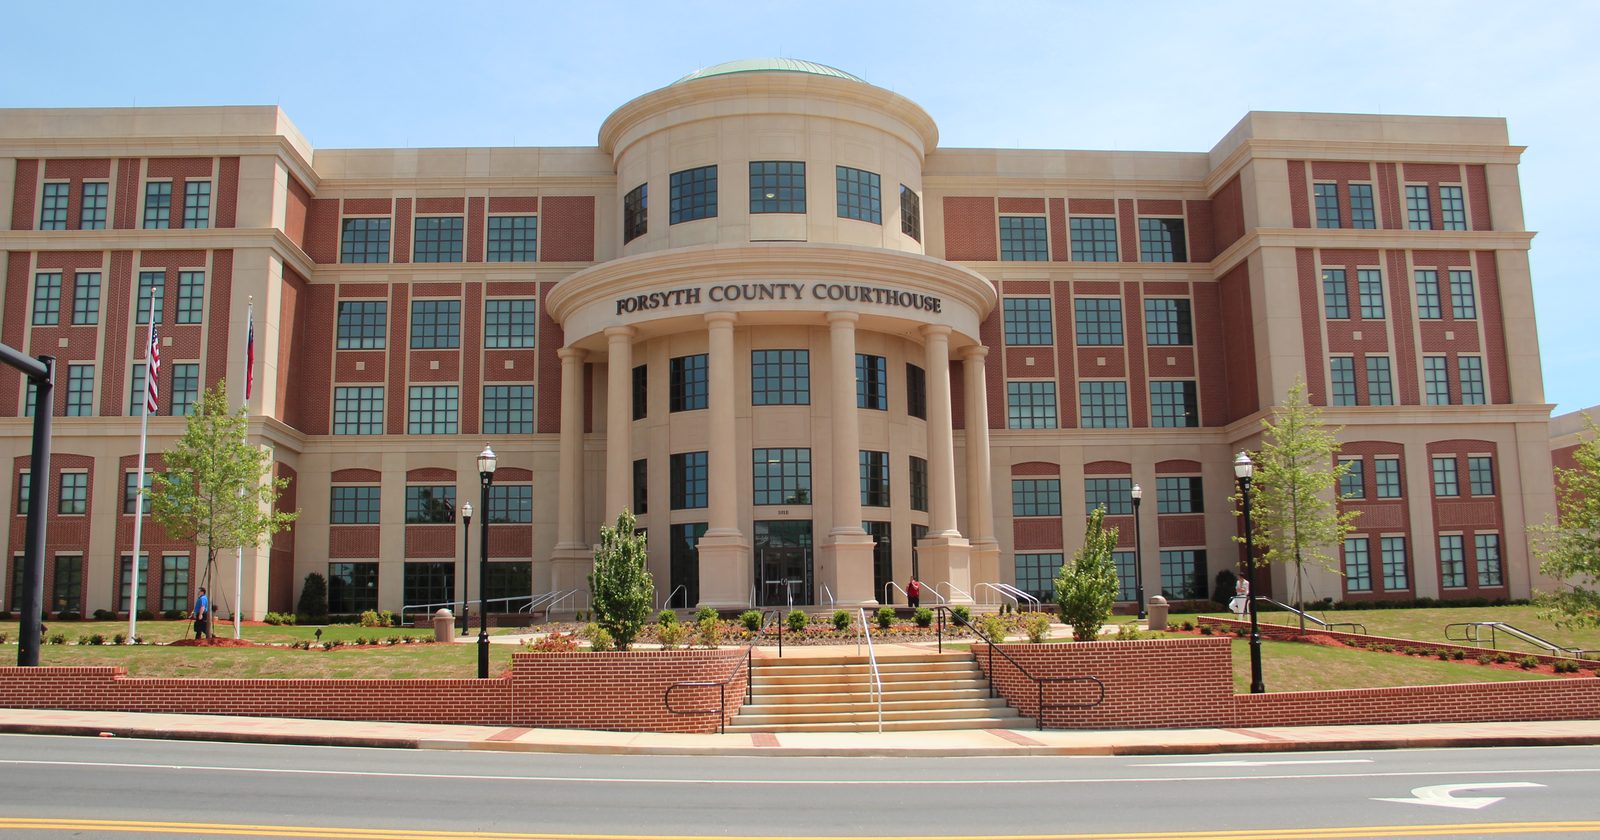
US Census Bureau, 2000 Census Summary File 1, table P8 (Hispanic or Latino by race). US Census Bureau, American Community Survey 5-year estimates 2020-2024, table B03002. US Census Bureau, Population Estimates Program, Vintage 2025 county totals. Diversity scores computed by CensusEasy; the county-level scores for the current year are also published on each county page and in the most diverse counties ranking. Photo: Forsyth County courthouse in Cumming, Georgia, by Thomson200 via Wikimedia Commons, CC0.
CensusEasy publishes original research grounded in US Census Bureau data. Every study includes the underlying numbers, methodology, and sources so readers can verify or extend the analysis.
Data note. Figures in this report are derived from US Census Bureau and Bureau of Labor Statistics data, including American Community Survey estimates that carry sampling margins of error. This information is provided as is, for general informational purposes, without warranty of accuracy or completeness. CensusEasy is not affiliated with or endorsed by the US Census Bureau or any government agency. See our Terms of Use for details.