Exploring America by Census Tract - What the Map and Rankings Reveal
See more of our coverage in your search results.
The Census Bureau divides the entire United States into 84,000 small statistical neighborhoods called census tracts. Each one covers roughly 1,200 to 8,000 residents, which is close enough to a real neighborhood that the data actually tells you something meaningful about a specific place, not just a city average that smooths over everything interesting. CensusEasy indexes all of them, and we built two tools specifically for people who want to explore the country at that level: an interactive map and a set of rankings that show which tracts sit at the extremes across income, density, home values, education, and poverty.
Here's what you can do with them.
The interactive tract map
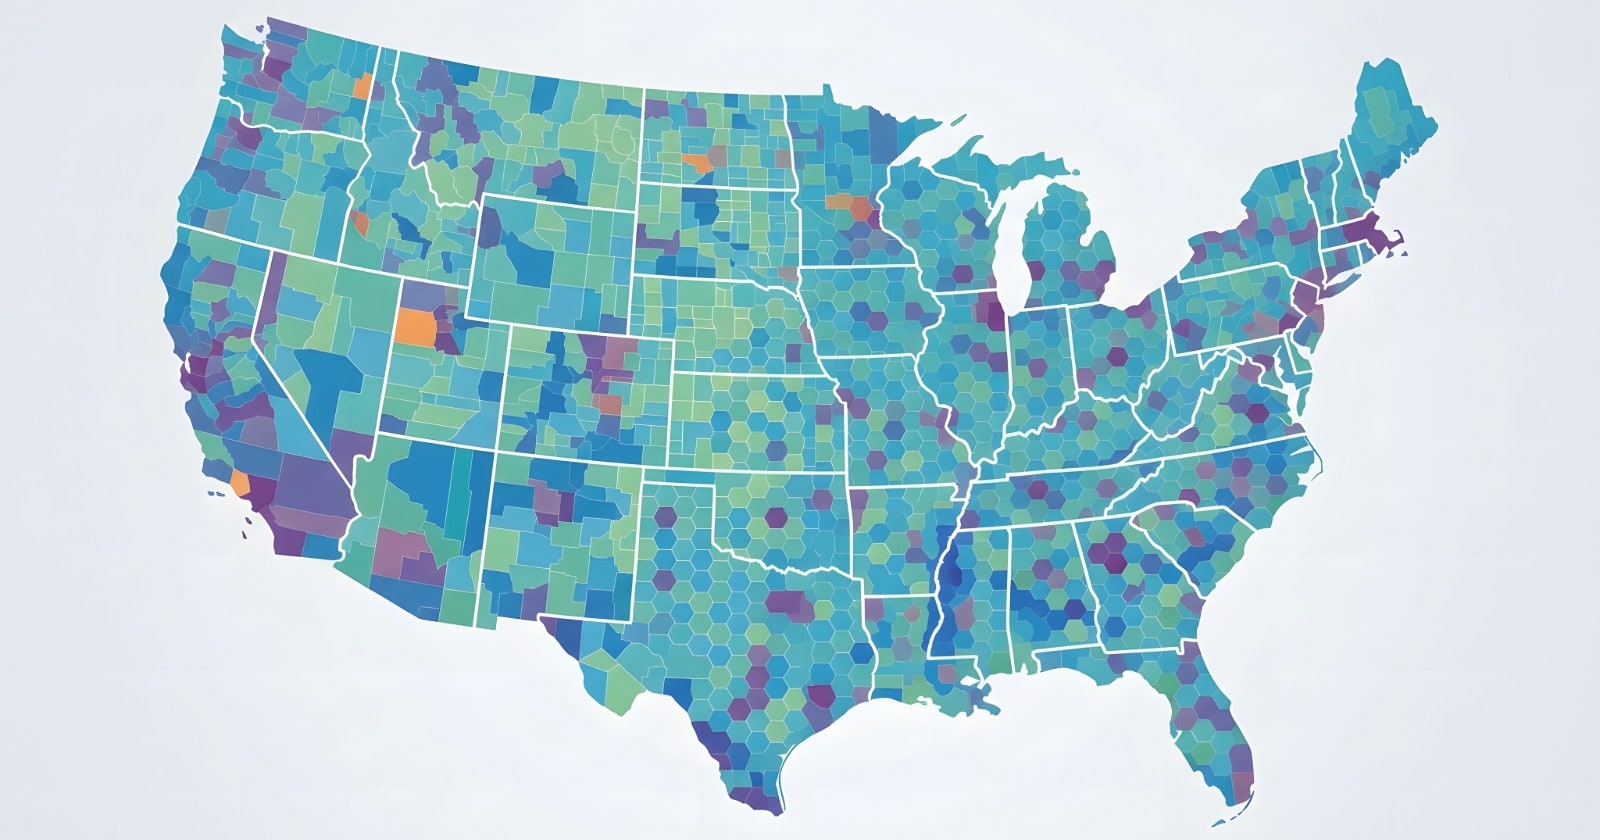
The census tract map covers all 50 states, DC, and Puerto Rico. You pan and zoom to anywhere in the country, the tract boundaries load as you navigate, and clicking any tract opens its full demographic profile: population, median household income, home values, education levels, poverty rate, age breakdown, and the historical time series going back to 1990. Tract boundaries come from the Census Bureau's TIGER/Line 2024 release, and each tract is linked to its unique 11-digit GEOID so there's no ambiguity about which neighborhood you're looking at.
The practical use case is obvious for anyone who has ever tried to research a specific neighborhood before a move. City-level data tells you about averages. The map lets you zoom into the exact blocks you're considering and see the numbers for that tract specifically, then pan one neighborhood over and compare. The income distribution in a tract two miles from the one you're looking at can look completely different, and that gap often persists for years or decades without being visible at the city level.
It's also just genuinely interesting to explore if you're curious about how the country is organized economically. Zoom into Manhattan and watch the density numbers change as you move block by block. Zoom into the Houston suburbs and see how many high-income tracts sit in what looks like undifferentiated sprawl from the outside. The map makes patterns visible that don't show up in any list or table.
The tract rankings
The tract rankings are where things get interesting. Six ranking categories, 200 tracts each, covering the full distribution from the extremes at the top to the extremes at the bottom. A few things that stand out in the current data:
The most populous single tract in the country is Tract 6732-02 in Fort Bend County, Texas with 44,364 residents. That's a single census tract, a unit designed to cover a neighborhood, with more people than many small American cities. It sits in the Houston metro, which has several of the country's most populous tracts including Tract 5429-02 in Harris County with 42,523 residents, and it reflects the density that can accumulate in master-planned suburban communities where apartment and townhome development has packed tens of thousands of people into a relatively small geographic footprint.
The densest tracts are almost entirely in New York City. The top tract, Tract 455 in Queens County, reaches 223,632 residents per square mile. To put that in context, the national average population density is around 94 people per square mile. The densest tract in the country packs more than 2,000 times that density into a single neighborhood. The top ten densest tracts are dominated by Manhattan and Queens, with tracts like Tract 261 and Tract 245 each exceeding 177,000 residents per square mile, and you have to scroll significantly to find a non-New York entry.
The highest-income tracts tell a different story than the highest-income cities. Several of the wealthiest tracts in the country are in the Philadelphia suburbs: Montgomery County, Bucks County, Chester County, and Delaware County all appear in the top ten, with tracts like Tract 2048 and Tract 2046 hitting the ACS ceiling of $250,000 in median household income. These are wealthy residential suburbs outside a major metro, not the most glamorous ZIP codes on paper, but the concentration of high-earning households in those specific tracts puts them at the top of a ranking of 84,000 places nationwide.
The highest home value tracts are dominated by Los Angeles County, specifically the hillside neighborhoods in the Santa Monica Mountains corridor. Tracts like Tract 2626-01 and Tract 2624 hit the ACS ceiling of $2,000,000 for median home value, which means the actual median is somewhere above that number and the survey instrument simply doesn't capture how expensive these neighborhoods really are. These are the Bel Air, Brentwood, and Pacific Palisades areas of Los Angeles, where the median home is worth more than most Americans will earn in their entire working lives.
The education rankings show something unexpected at the very top: Tract 122 in Centre County, Pennsylvania, home to Penn State University, comes in at 100% bachelor's degree attainment, as do several other university-adjacent tracts. These are cases where the tract boundary essentially coincides with a campus or graduate student housing area, and the population is overwhelmingly composed of people who either hold or are pursuing degrees. Below the university tracts, the most educated residential communities cluster in DC suburbs, the Philadelphia suburbs, and Research Triangle-adjacent areas including Tract 538-03 in Wake County and Tract 27-01 in Mecklenburg County, North Carolina.
What tract-level data reveals that city data hides
The most useful thing about exploring tracts rather than cities is that it breaks the averaging effect that makes city-level data misleading for actual decisions. A city with an $80,000 median household income might have fifty tracts ranging from $35,000 to $210,000. When you're deciding whether to buy a home in a specific neighborhood, the city median is essentially useless. The tract median is the number that applies to where you're actually going to live.
The same principle applies to poverty rates, home values, and education levels. These variables are highly spatially concentrated. Poor tracts and wealthy tracts often sit within a few miles of each other, separated by a highway or a park boundary or just the invisible lines of how a city developed over decades. The map makes those lines visible in a way that no amount of city-level research can replicate.
You can start with the tract rankings to get a sense of what the extremes look like nationally, then use the interactive map to zoom into any metro area and see how specific neighborhoods stack up against each other and against the country as a whole.
Add CensusEasy as a preferred source on Google to see our stories first.
 METHODS
How the Census Could Be Improved Before 2030
The 2020 census nailed the national total but missed a million young children and undercounted Black, Hispanic, and Native residents. Here are the four fixes on the table for 2030, from administrative records to reliable technology.
 METHODS
Should the Census Ask About Religion?
The census asks your age, income, and commute but never your religion, and since 1976 it is legally barred from requiring the answer. The case for and against adding it.
 METHODS
The Census Bureau Is Lining Up a $1 Billion Contract to Build the 2030 Count
The Census Bureau will hold a July 21 industry day as it plans a small-business contract worth up to $1 billion to build the technology behind the 2030 census.
What is a census tract map used for?
A census tract map lets you zoom into specific neighborhood-sized areas and see local data like population, income, home values, education, poverty, and age breakdowns.
Why is census tract data better than city-level data for neighborhood research?
Census tract data is more useful for neighborhood decisions because city averages can hide huge differences in income, poverty, home values, and education from one area to the next.
How many census tracts are there in the United States?
The Census Bureau divides the United States into about 84,000 census tracts, each generally covering roughly 1,200 to 8,000 residents.