
The most geographically concentrated ancestry groups in America
Six in 10 Guyanese Americans live in the New York metro, the highest share of any group in a single metro area. English and Scottish Americans are the most spread out, and New York is the largest community for 43 of 102 groups.
See more of our coverage in your search results.
Six in 10 Guyanese Americans live in the New York metro area: 154,835 of the 259,052 people nationwide who report Guyanese ancestry, or 59.8 percent. That makes them the most geographically concentrated of the 102 ancestry and origin groups with at least 50,000 people in the U.S. Census Bureau's 2020-2024 American Community Survey. They are also the only group where one metro area holds more than half of the national total.
At the other end, English and Scottish Americans are the most spread out. The largest single community of each holds just 2.3 percent of the group, and it takes 58 metro areas to account for half of all Americans of English ancestry.
The measure here is simple: the share of each group's national population that lives in its single largest metro area. It answers a question that raw counts can't. New York has more Italian Americans than any other metro, 2.13 million, but that is only 13.2 percent of the country's 16.2 million. New York's 1.19 million Dominican Americans are 49.1 percent of all Dominican Americans.
The 20 most concentrated groups
New York is the largest community for nine of the top 20, and every group in the top 10 has its largest community in one of five East or West Coast metros: New York, Miami, Los Angeles, Boston, or Washington. Caribbean and Latin American groups dominate the top of the list. Guyanese, Ecuadorian, Dominican, Cuban, Barbadian, Trinidadian and Tobagonian, and Bolivian Americans all rank in the top 10.
| Rank | Group | Population | Largest metro | Share there | Metros holding half |
|---|---|---|---|---|---|
| 1 | Guyanese | 259,052 | New York | 59.8% | 1 |
| 2 | Ecuadorian | 910,779 | New York | 49.1% | 2 |
| 3 | Dominican | 2,422,597 | New York | 49.1% | 2 |
| 4 | Cuban | 2,593,343 | Miami | 44.6% | 2 |
| 5 | Armenian | 462,097 | Los Angeles | 43.6% | 3 |
| 6 | Bangladeshi | 263,277 | New York | 43.3% | 3 |
| 7 | Barbadian | 72,430 | New York | 40.6% | 3 |
| 8 | Cape Verdean | 106,701 | Boston | 40.3% | 2 |
| 9 | Trinidadian and Tobagonian | 253,258 | New York | 39.7% | 3 |
| 10 | Bolivian | 139,552 | Washington | 34.0% | 4 |
| 11 | Somali | 166,157 | Minneapolis | 30.9% | 3 |
| 12 | Haitian | 1,131,642 | Miami | 29.5% | 2 |
| 13 | Native Hawaiian | 689,045 | Honolulu | 28.5% | 5 |
| 14 | Hmong | 344,001 | Minneapolis | 28.3% | 4 |
| 15 | Jamaican | 1,272,037 | New York | 26.8% | 4 |
| 16 | Nicaraguan | 520,566 | Miami | 26.4% | 5 |
| 17 | Venezuelan | 842,372 | Miami | 25.6% | 5 |
| 18 | Israeli | 147,395 | New York | 24.4% | 6 |
| 19 | Iranian | 518,774 | Los Angeles | 24.3% | 7 |
| 20 | Egyptian | 329,847 | New York | 23.1% | 8 |
Some of the most concentrated groups cluster in metros that aren't national immigration gateways. Somali and Hmong Americans are both most concentrated in Minneapolis-St. Paul, the largest community for each. For the Hmong, the metro outranks every California metro even though California has more Hmong residents than any other state. Cape Verdean Americans are the most concentrated by a wider measure: 76.2 percent live in their three largest metros, the highest three-metro share of any group, and 74.6 percent live in just two, Boston and Providence.
The least concentrated groups
Most of the least concentrated groups are Northern and Western European ancestries. English, Scottish, Scotch-Irish, Welsh, Swiss, German, and French Americans each have 3 percent or less of their national population in their largest metro, and it takes between 46 and 58 metros to account for half of each group.
| Rank | Group | Population | Largest metro | Share there | Metros holding half |
|---|---|---|---|---|---|
| 1 | English | 31,698,663 | Dallas | 2.3% | 58 |
| 2 | Scottish | 5,562,559 | New York | 2.3% | 53 |
| 3 | Scotch-Irish | 2,522,548 | Dallas | 2.5% | 55 |
| 4 | Swiss | 849,422 | New York | 2.6% | 51 |
| 5 | Welsh | 1,586,180 | Philadelphia | 2.6% | 51 |
| 6 | German | 41,767,410 | Chicago | 2.9% | 55 |
| 7 | French | 6,412,949 | Boston | 2.9% | 46 |
| 8 | British | 1,244,871 | New York | 3.6% | 37 |
| 9 | Danish | 1,134,225 | Salt Lake City | 3.8% | 35 |
| 10 | Laotian | 173,695 | Dallas | 4.8% | 20 |
German Americans, the largest group in this study at 41.8 million, have more people in the Chicago metro than anywhere else, but that is 2.9 percent of the total. Laotian Americans are the only Asian group in the bottom 10. Their largest community, in the Dallas metro, has 8,257 people, 4.8 percent of the total, and it takes 20 metros to account for half of them.
New York is home base for 43 groups
The New York metro is the single largest community for 43 of the 102 groups, including Italian, Chinese, Indian, Puerto Rican, Russian, and Jamaican Americans. Los Angeles is the largest for 12, among them Mexican, Korean, Filipino, Vietnamese, and Salvadoran Americans. Chicago leads for eight, mostly Central and Eastern European groups such as Polish, Lithuanian, Serbian, Croatian, and Czech Americans.
| Rank | Metro area | Groups whose largest community is here |
|---|---|---|
| 1 | New York, NY | 43 |
| 2 | Los Angeles, CA | 12 |
| 3 | Chicago, IL | 8 |
| 4 | Miami, FL | 5 |
| 4 | Minneapolis, MN | 5 |
| 4 | Boston, MA | 5 |
| 7 | Dallas, TX | 4 |
| 8 | Detroit, MI | 3 |
| 8 | Honolulu, HI | 3 |
Several smaller metros are the largest community for a single group: Slovene Americans in Cleveland, Slovak Americans in Pittsburgh, Dutch Americans in Grand Rapids, Portuguese Americans in Providence, and Tongan Americans in Salt Lake City. The Dallas metro is the largest community for Nepalese Americans, and Detroit for Iraqi and Lebanese Americans.
By state, California is the largest home for 45 of the 102 groups, Florida for 14, and New York for 13. The group most concentrated in a single state is Fijian Americans, 72.0 percent of whom live in California. Next are Cuban Americans, 62.9 percent of whom live in Florida, and Cape Verdean Americans, 59.9 percent of whom live in Massachusetts.
Every group in this study has its own profile on the origins and ancestry hub, with state, metro, county, and city rankings. Recent profiles in the same series cover Ethiopian, Cuban, and Indian Americans.
Add CensusEasy as a preferred source on Google to see our work first.
Which ancestry group is most concentrated in one city?
Guyanese Americans. Of the 259,052 people who report Guyanese ancestry, 154,835, or 59.8 percent, live in the New York metro area, according to the 2020-2024 American Community Survey. It is the only group of 50,000 or more where one metro holds more than half.
Which ancestry groups are the most spread out in the US?
English and Scottish Americans. The largest single metro community of each holds just 2.3 percent of the group, and it takes 58 metros to account for half of all Americans of English ancestry. Scotch-Irish, Swiss, Welsh, German, and French Americans are similarly dispersed.
Which metro area is home to the most ancestry groups?
The New York metro is the single largest community for 43 of the 102 ancestry and origin groups with at least 50,000 people, including Italian, Chinese, Indian, and Puerto Rican Americans. Los Angeles leads for 12 groups and Chicago for eight.
Each group's national population is the sum of its counts in the 50 states and the District of Columbia in the 2020-2024 American Community Survey 5-year estimates. Hispanic origin groups come from table B03001, detailed Asian groups from table B02015, Native Hawaiian and Pacific Islander groups from table B02019, and ancestry groups from table B04006. Ancestry is self-reported and a person may report more than one, so the ancestry counts are counts of people reporting each ancestry and can overlap.
Metro area counts use the 2023 Office of Management and Budget delineations of metropolitan and micropolitan statistical areas, summed from each area's current component counties. The concentration measure is the largest metro area's count divided by the national count. "Metros holding half" is the smallest number of metro areas, taken from largest to smallest, whose combined count reaches half of the national total. The three-metro share adds the three largest metro communities. The largest state is measured the same way.
The rankings and tables cover the 102 groups with a national population of at least 50,000. The CSV includes all 113 groups the site tracks at the metro level. Regional totals that contain other groups on the list (Central American, South American, West Indian, and Arab) and the write-in "American" ancestry are excluded. Estimates are subject to sampling error, which is larger for small groups and small areas.
You may cite or republish these findings, and the downloadable dataset is licensed under CC BY 4.0. Reuse requires that you credit CensusEasy and link back to this page so readers can verify the underlying data.
CensusEasy Data Team (2026). "The most geographically concentrated ancestry groups in America." CensusEasy. Retrieved from https://censuseasy.com/studies/most-concentrated-ancestry-groups-in-america
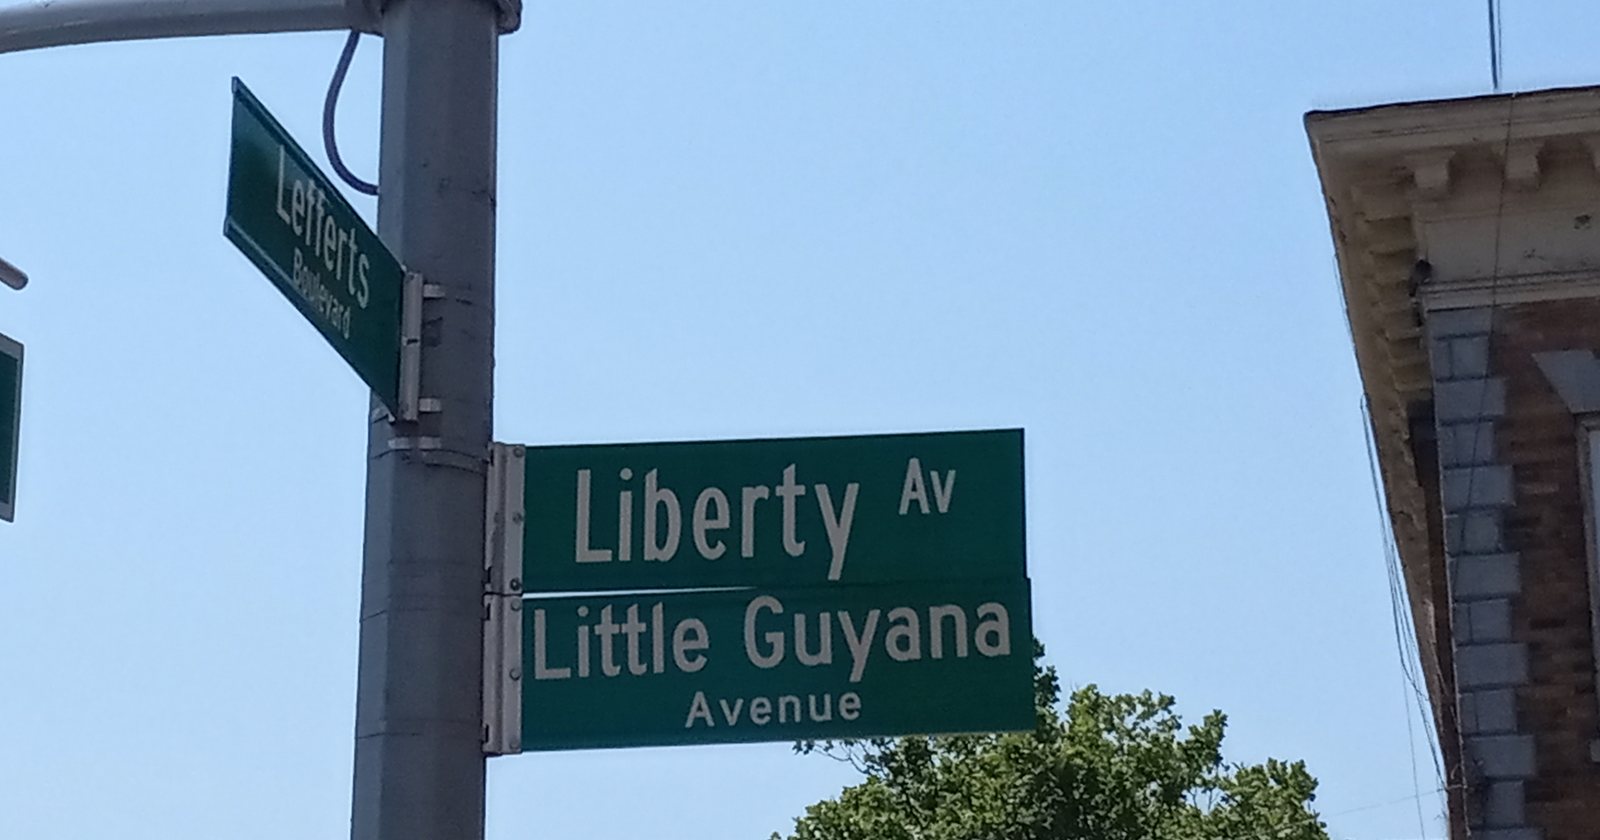
US Census Bureau, American Community Survey 5-year estimates, 2020-2024, tables B03001 (Hispanic or Latino origin by specific origin), B02015 (detailed Asian groups), B02019 (detailed Native Hawaiian and Other Pacific Islander groups), and B04006 (people reporting ancestry). Metro area definitions from the Office of Management and Budget, 2023 delineation files. Concentration shares computed by CensusEasy; each group's full state, metro, county, and city rankings are on the origins and ancestry hub. Photo: Little Guyana Avenue street sign at Liberty Avenue and Lefferts Boulevard, Richmond Hill, Queens, by Kidfly182, via Wikimedia Commons, licensed CC BY 4.0, cropped to fit.

CensusEasy publishes original research grounded in US Census Bureau data. Every study includes the underlying numbers, methodology, and sources so readers can verify or extend the analysis.
Data note. Figures in this report are derived from US Census Bureau and Bureau of Labor Statistics data, including American Community Survey estimates that carry sampling margins of error. This information is provided as is, for general informational purposes, without warranty of accuracy or completeness. CensusEasy is not affiliated with or endorsed by the US Census Bureau or any government agency. See our Terms of Use for details.