America's foreign-born share is back to its 1890 record
See more of our coverage in your search results.
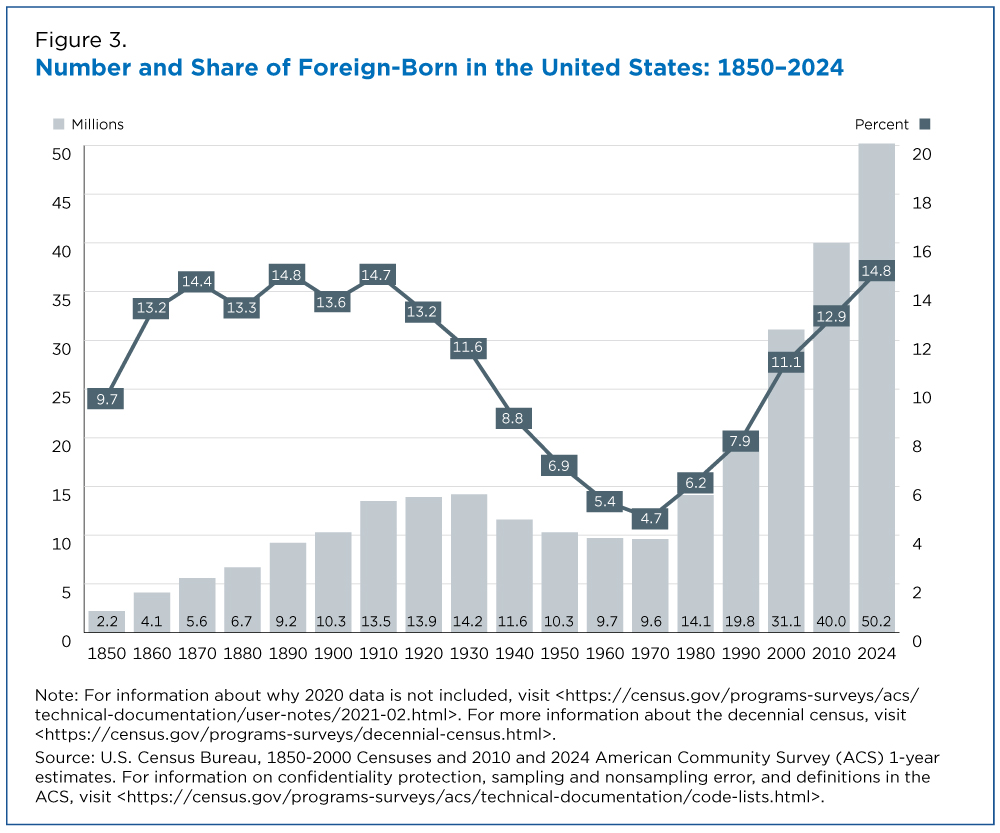
In 2024, 50.2 million U.S. residents were born in another country, the most in the nation's history. As a share of the population, that's 14.8 percent, or about one in seven people. It's also a number the country has hit before, at the very peak of the last great immigration wave, in 1890. By share, America is right back where it stood 134 years ago.
That's the arc the Census Bureau traced in a recent story marking the country's 250th anniversary, using data it has collected every decade since 1850, the first census that asked every free resident where they were born. The long view is a deep U: a high in the 1800s, a long slide to a historic low, and a climb back to the top.
From the 1890s peak to the 1970s floor and back again
The foreign-born share started at 9.7 percent in 1850, when 2.2 million people counted as foreign-born. It climbed fast, hitting 14.4 percent by 1870 and peaking at 14.8 percent in 1890, during the wave of European immigration that built the industrial cities of the Northeast and Midwest.
Then it fell, and kept falling. The restrictive immigration laws of the 1920s cut the flow to a trickle, the Great Depression and two world wars further kept it low, and by 1970 the foreign-born share had dropped to 4.7 percent, the lowest on record. A person born in 1950 grew up in the most native-born America the country had ever measured.
The 1965 immigration reforms, which scrapped the old national-origin quotas, reversed it. The share has risen every decade since, from 4.7 percent in 1970 to 14.8 percent in 2024. The number of people, 50.2 million, blew past any prior mark, because the 14.8 percent of 2024 is a slice of a 340-million-person country, while the 14.8 percent of 1890 was a slice of a nation one-fifth that size.
Europe out, Latin America and Asia in
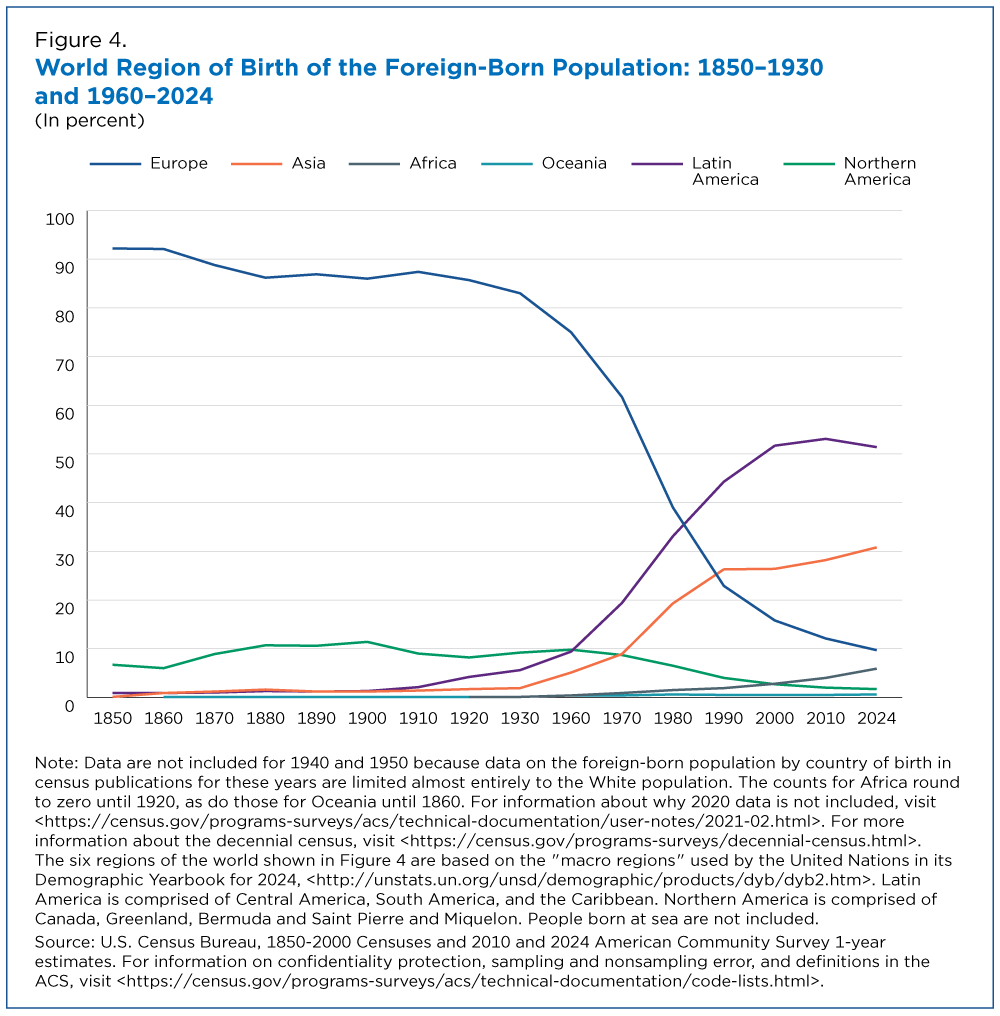
The bigger change is where the foreign-born come from. In 1850, Europe accounted for more than 90 percent of the foreign-born population. That dominance held until the mid-1900s, then collapsed. Asia passed Europe by 1990, powered by refugee resettlement after the Vietnam War and demand for skilled workers, and Latin America surged past both.
Today the map is inverted. Latin American countries account for 51.4 percent of the foreign-born, Asian countries 30.8 percent, and Europe just 9.7 percent, now third and still falling. Africa is the fastest riser, at 5.9 percent and climbing. Mexico remains the single largest country of origin by a wide margin, the story behind our Mexican Americans origin page.
Where the foreign-born actually live
The foreign-born don't spread evenly across the country. They cluster in a handful of gateway states and metros, and the gap between the top and bottom is enormous.
By our American Community Survey figures, California is 27.0 percent foreign-born, the highest of any state, followed by New Jersey, New York, and Florida, all above 21 percent. At the other end, West Virginia is 1.8 percent foreign-born, Montana 2.3, and Mississippi 2.4. A resident of California is about 15 times as likely to have been born abroad as a resident of West Virginia.
| Rank | State | Foreign-born share |
|---|---|---|
| 1 | California | 27.0% |
| 2 | New Jersey | 23.9% |
| 3 | New York | 22.8% |
| 4 | Florida | 21.9% |
| 5 | Nevada | 19.1% |
| 6 | Massachusetts | 18.0% |
| 7 | Hawaii | 17.9% |
| 8 | Texas | 17.6% |
Zoom into metros and the concentration is sharper still. The Miami metro is 42.4 percent foreign-born, and San Jose is 40.8 percent, so in Silicon Valley's core two of every five residents were born abroad. Los Angeles, San Francisco, and New York all sit above 30 percent. By raw count, the New York metro alone holds nearly 6 million foreign-born residents, more than most entire states have people.
That's the piece the 14.8 percent national number can't show. The country as a whole is back to its 1890 record, but "the country as a whole" describes almost nowhere in particular. The full ranking of every state is at most foreign-born states, and every metro at largest foreign-born metro populations.
Sources
The national history, the 50.2 million and 14.8 percent figures, and the region-of-birth shares are from the U.S. Census Bureau's America Counts story on 250 years of the foreign-born population, drawn from the 1850 to 2000 censuses and the 2010 and 2024 American Community Survey 1-year estimates. State and metro shares are CensusEasy figures from the American Community Survey 5-year estimates, which average recent years and put the national share near 14.1 percent, slightly below the single-year 2024 mark.
Add CensusEasy as a preferred source on Google to see our stories first.
 GENERAL
Before you move to Austin: what the census data says
Austin doubled in size since 1990 and home values jumped about 55% since 2020. Here's what the Census numbers actually show about the city, the metro, and the suburban ring before you make the move.
 GENERAL
St. Louis has lost 30% of its people since 1990, but the region around it hasn't
The city of St. Louis had 278,144 residents in 2025, down from 396,685 in 1990. The metro area grew over the same period, and nearly all the loss is inside city limits that haven't changed since 1876.
 GENERAL
Black household income rises 76% since 1967, but dollar gap with White households widens
Census figures back to 1967 show Black median household income up 76.2 percent after inflation, to $59,980. The ratio to non-Hispanic White income narrowed, but the gap in dollars grew to $36,730.
What share of the US population is foreign-born?
In 2024, 14.8 percent of US residents were foreign-born, about one in seven people, or 50.2 million out of 340.1 million. That share ties the all-time high the country first reached in 1890, though the raw number is far larger because the population is much bigger now.
When was the foreign-born share highest and lowest?
The foreign-born share peaked at 14.8 percent in 1890, during the wave of European immigration, and 2024 ties that record. It fell to its lowest point on record, 4.7 percent, in 1970, after the restrictive immigration laws of the 1920s, the Depression, and two world wars. It has risen every decade since the 1965 immigration reforms.
Which states have the most foreign-born residents?
By share, California leads at 27.0 percent foreign-born, followed by New Jersey, New York, and Florida, all above 21 percent, based on American Community Survey 5-year estimates. West Virginia is the lowest at 1.8 percent. Among metros, Miami is 42.4 percent foreign-born and San Jose 40.8 percent.