
Where young adults are moving: the metros where 25- to 34-year-olds grew fastest
The number of Americans ages 25 to 34 grew 11.5 percent from 2010 to 2020-2024. Lakeland, Austin, and Orlando grew more than three times as fast, while Chicago was the only metro of 2 million people to lose young adults.

See more of our coverage in your search results.
The number of Americans ages 25 to 34 grew 48.5 percent in the Lakeland, Florida, metro area between the 2010 census and the Census Bureau's 2020-2024 survey estimates, the fastest growth of any metro with at least 500,000 people. Austin was second at 42.9 percent, followed by Orlando at 38.6 percent and Colorado Springs at 37.9 percent.
Nationally, the 25-to-34 population rose from 41.1 million to 45.8 million, up 11.5 percent, faster than the 8.5 percent growth of the population as a whole. Much of that national rise is the large millennial generation moving into its late 20s and early 30s, so the useful comparison for any one metro is how far it ran ahead of, or behind, that 11.5 percent.
By that measure the map is lopsided. Of the 106 metro areas with at least 500,000 residents, 73 grew their young-adult population faster than the country, and 10 of the 25 fastest are in Florida. Only four had fewer 25- to 34-year-olds than in 2010.
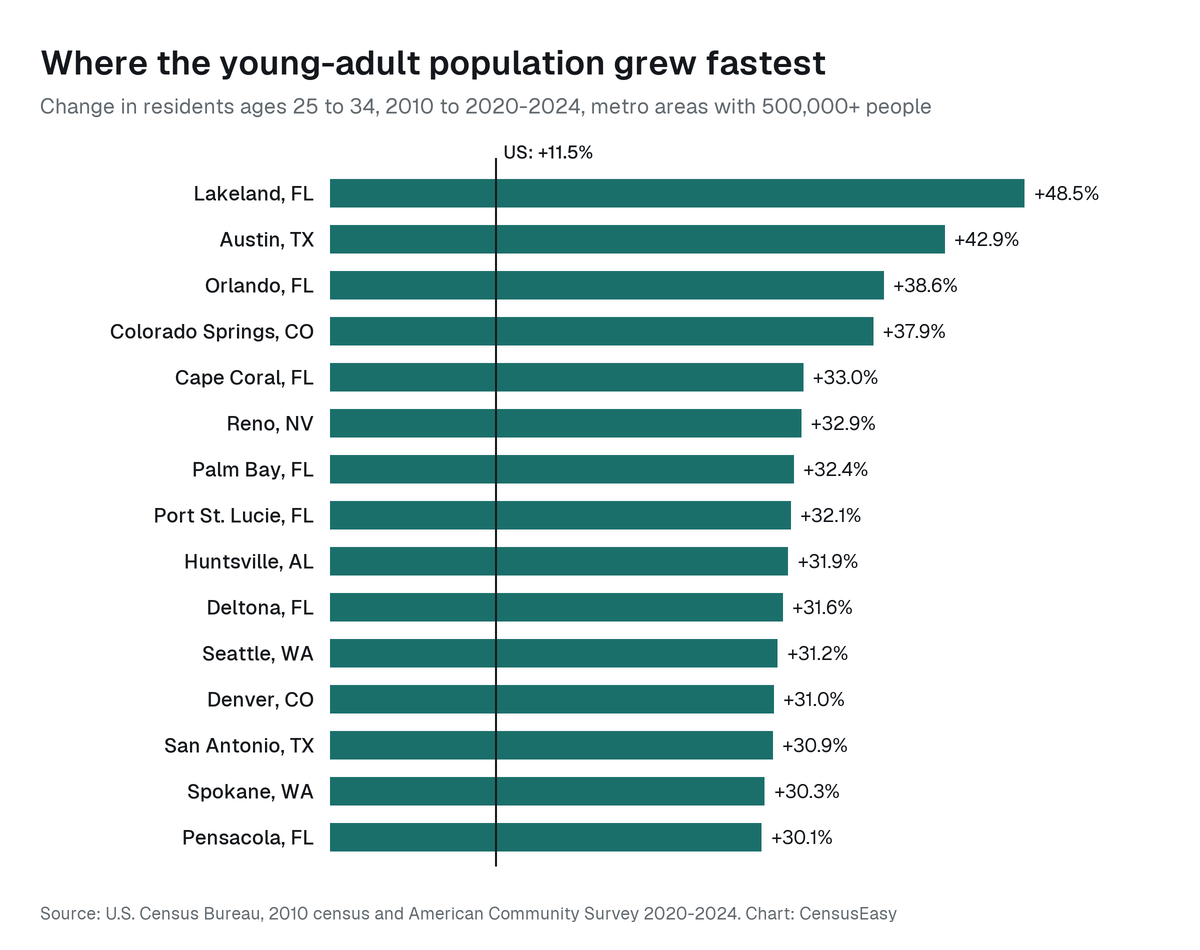
These are the 25 metro areas where the young-adult population grew fastest.
| Rank | Metro area | Ages 25-34, 2010 | Ages 25-34, 2020-24 | Change | Share of residents |
|---|---|---|---|---|---|
| 1 | Lakeland, FL | 71,248 | 105,773 | +48.5% | 13.4% |
| 2 | Austin, TX | 290,552 | 415,178 | +42.9% | 17.1% |
| 3 | Orlando, FL | 296,138 | 410,535 | +38.6% | 14.7% |
| 4 | Colorado Springs, CO | 89,335 | 123,192 | +37.9% | 16.0% |
| 5 | Cape Coral, FL | 65,878 | 87,632 | +33.0% | 10.7% |
| 6 | Reno, NV | 62,496 | 83,042 | +32.9% | 14.7% |
| 7 | Palm Bay, FL | 54,795 | 72,522 | +32.4% | 11.5% |
| 8 | Port St. Lucie, FL | 42,546 | 56,219 | +32.1% | 10.8% |
| 9 | Huntsville, AL | 55,009 | 72,584 | +31.9% | 14.0% |
| 10 | Deltona, FL | 59,853 | 78,761 | +31.6% | 11.2% |
| 11 | Seattle, WA | 523,970 | 687,561 | +31.2% | 16.9% |
| 12 | Denver, CO | 390,192 | 511,004 | +31.0% | 17.0% |
| 13 | San Antonio, TX | 298,713 | 390,985 | +30.9% | 14.7% |
| 14 | Spokane, WA | 66,004 | 86,006 | +30.3% | 14.4% |
| 15 | Pensacola, FL | 56,707 | 73,774 | +30.1% | 14.1% |
| 16 | Tampa, FL | 337,822 | 437,817 | +29.6% | 13.2% |
| 17 | Nashville, TN | 245,217 | 317,438 | +29.5% | 15.3% |
| 18 | North Port, FL | 63,935 | 82,710 | +29.4% | 9.3% |
| 19 | Jacksonville, FL | 180,439 | 232,850 | +29.0% | 13.8% |
| 20 | Fayetteville, AR | 66,484 | 85,183 | +28.1% | 14.7% |
| 21 | Boise, ID | 87,311 | 111,835 | +28.1% | 13.8% |
| 22 | Raleigh, NC | 165,547 | 211,466 | +27.7% | 14.2% |
| 23 | Charlotte, NC-SC | 310,676 | 393,680 | +26.7% | 14.2% |
| 24 | Portland, ME | 58,630 | 73,601 | +25.5% | 13.1% |
| 25 | Dallas, TX | 951,428 | 1,188,358 | +24.9% | 14.9% |
Florida's list is long but its young adults are spread thin. In North Port and Cape Coral, the young-adult population grew about as fast as the population overall, and 25- to 34-year-olds still make up only 9.3 and 10.7 percent of residents, the two lowest shares of any metro with 500,000 people. Lakeland is different: its young-adult share rose from 11.8 to 13.4 percent.
Austin stands out on every measure. It added 124,626 people ages 25 to 34, and they now make up 17.1 percent of the metro, the highest share of any metro of 500,000 or more. Denver (17.0 percent) and Seattle (16.9 percent) are next. Both also grew their young-adult populations by about 31 percent, well ahead of their overall growth of about 18 percent.
In raw numbers, Dallas added the most young adults, 236,930, followed by Houston (170,110), Seattle (163,591), and New York (159,296).
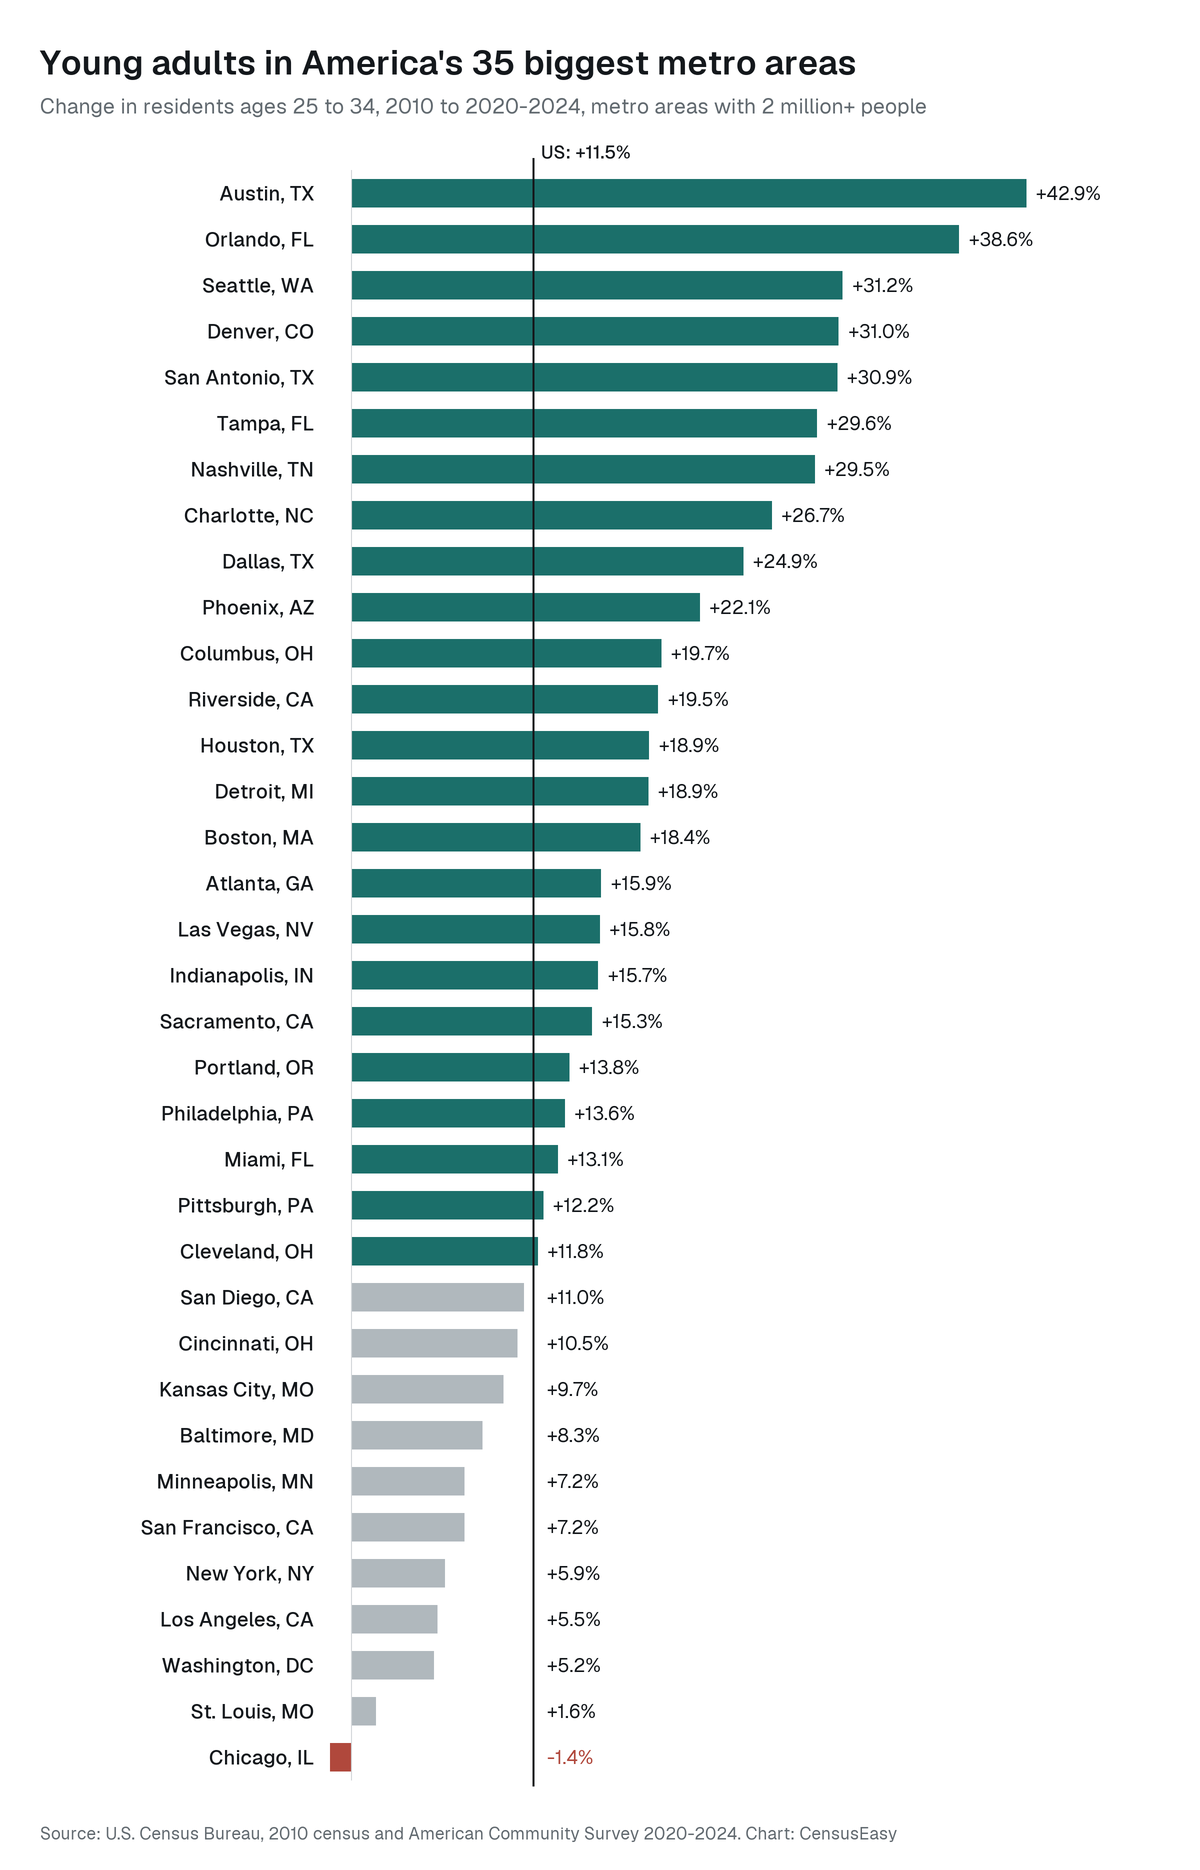
Chicago is the only metro of 2 million or more people with fewer residents ages 25 to 34 than in 2010, down 18,248, or 1.4 percent. The other three metros of 500,000 or more that lost young adults are in the Deep South: Jackson, Mississippi (-6.9 percent), New Orleans (-3.9 percent), and Baton Rouge (-1.6 percent).
Several of the country's biggest coastal metros grew more slowly than the nation. Washington, D.C., rose 5.2 percent, Los Angeles 5.5 percent, New York 5.9 percent, and San Francisco 7.2 percent. In Washington, the young-adult share of residents fell from 15.4 to 14.2 percent. Not every pricey metro lagged, though: San Jose grew 14.1 percent.
The Rust Belt tells a quieter story. The Detroit metro's total population grew just 1.9 percent, but its 25-to-34 population rose 18.9 percent, lifting their share from 11.8 to 13.7 percent. Pittsburgh and Cleveland both had slightly fewer residents overall than in 2010 yet gained young adults, up 12.2 and 11.8 percent.
The full list of all 106 metros is available as a CSV download. For where the country's population is headed overall, see the metros that grew the most since 1990, and for the other end of the age range, the counties aging fastest.
Add CensusEasy as a preferred source on Google to see our work first.
Which metro area is gaining the most young adults?
Lakeland, Florida, grew its population ages 25 to 34 fastest, up 48.5 percent from 2010 to 2020-2024, among metros of 500,000 or more. Dallas added the most young adults in raw numbers, about 237,000.
Which cities are losing young adults?
Among metros with at least 500,000 people, only four had fewer residents ages 25 to 34 in 2020-2024 than in 2010: Jackson, Mississippi, New Orleans, Baton Rouge, and Chicago, the only one with more than 2 million people.
How many Americans are 25 to 34 years old?
About 45.8 million Americans were ages 25 to 34 in the Census Bureau's 2020-2024 estimates, up from 41.1 million in the 2010 census, an increase of 11.5 percent.
We compared the number of residents ages 25 to 34 in each metropolitan statistical area in the 2010 decennial census (April 1, 2010) with the American Community Survey 5-year estimates for 2020-2024, the most recent estimates available for every metro. The 2010 figures come from census table P12 (sex by age) and the 2020-2024 figures from ACS table B01001; both are summed across the 25-29 and 30-34 age groups.
Metro areas use the Office of Management and Budget's current delineations. Each metro's figures for both years are built from the counties that make it up today, so boundary changes don't affect the comparison. The ranking covers the 106 metropolitan areas with at least 500,000 residents in the 2020-2024 estimates.
The 2020-2024 estimates pool five years of survey responses and describe the population over that period rather than a single date, roughly centered on 2022. They come from a sample and carry margins of error; for metros this large the margins on the 25-to-34 count are small relative to the changes shown, but metros with nearly identical growth rates should be treated as tied. Nationally the 25-to-34 group grew 11.5 percent, largely because the millennial generation aged into it, so growth above that rate is the better signal of a metro gaining young adults.
You may cite or republish these findings, and the downloadable dataset is licensed under CC BY 4.0. Reuse requires that you credit CensusEasy and link back to this page so readers can verify the underlying data.
CensusEasy Data Team (2026). "Where young adults are moving: the metros where 25- to 34-year-olds grew fastest." CensusEasy. Retrieved from https://censuseasy.com/studies/metros-where-young-adults-grew-most-since-2010
U.S. Census Bureau, 2010 Census Summary File 1, table P12; American Community Survey 5-year estimates for 2020-2024, table B01001; Office of Management and Budget metropolitan statistical area delineations. Full data: metros-where-young-adults-grew-most-since-2010.csv. Charts by CensusEasy. Hero photo of Lady Bird Lake and the Austin skyline by Rish0203 via Wikimedia Commons, released under CC0.

CensusEasy publishes original research grounded in US Census Bureau data. Every study includes the underlying numbers, methodology, and sources so readers can verify or extend the analysis.
Data note. Figures in this report are derived from US Census Bureau and Bureau of Labor Statistics data, including American Community Survey estimates that carry sampling margins of error. This information is provided as is, for general informational purposes, without warranty of accuracy or completeness. CensusEasy is not affiliated with or endorsed by the US Census Bureau or any government agency. See our Terms of Use for details.