Stories

What Will the US Population Be in 2050?
Population projections are educated guesses, and the Census Bureau is the first to say so. Every projection comes with a range of scenarios built around different assumptions about birth rates, death rates, and immigration levels, and the gap between the high and low scenarios in 2050 runs to...


What Is the Purpose of a Census?
The US Census exists because the Constitution requires it. Article I, Section 2 mandates an "actual Enumeration" of the population every ten years, and the original reason was simple: to divide political power fairly among the states. But the census has grown into something...


What Happens If You Don't Fill Out the Census?
Filling out the census is not optional, at least on paper. Federal law requires every US resident to participate in the decennial Census, and there are penalties on the books for refusal. But the practical reality of what actually happens if you don't respond is a lot more nuanced than the legal language suggests...

Which Race Is Increasing the Most in the United States?
The United States has been getting more racially and ethnically diverse with every Census count for decades. But not all groups are growing at the same pace, and the answer to which group is growing fastest depends on whether you measure by percentage growth rate or by raw numbers added. Both ways of looking at it tell an interesting story...

What Does Census Mean?
A census is an official count of an entire population. The word comes from Latin - specifically from censere, meaning "to assess" or "to estimate." According to...

How Texas's Population Has Changed Since 1990
Texas added more residents in 2024 than any other state in the country. It has done so in most years since 1990. The current Texas...

Before You Move to Nashville: What the Census Data Says
Nashville has been one of the most talked-about relocation destinations in America for the past decade. The no-income-tax pitch, the music culture, the relative affordability compared to coastal cities - it all adds up to a compelling story. But the Census data tells a more complicated version of that story, one that includes a poverty rate that stays stubbornly above...

How California's Population Has Changed Since 1990
California is still the most populous state in the country by a wide margin, home to 39.3 million people and roughly 11.7% of the entire US population. But the demographic story of the past 35 years is not one of unchecked growth. It is a story of a state that grew explosively through the 1990s, hit a plateau in the 2000s, absorbed an...

The 10 Richest Cities in Texas in 2026
Three Texas cities rank in the top five wealthiest cities in the entire country by median household income. That is not a typo. Southlake, University Park, and West University Place all hit the ACS ceiling of $250,001 and land at positions three, four, and five on the national list, trailing only two small California communities. For a state whose identity is...

What the Census Data Reveals About Midtown Atlanta as One of the Densest Spots in the Southeast
Atlanta has a reputation for sprawl, and most of the metro earns it. The region covers more than 8,300 square miles, with a metro density of just 630 residents per square mile, which puts it among the most spread-out large metros in the country. But Midtown Atlanta, the two-mile stretch of high-rises, walkable streets, and dense residential towers running along Peachtree Street between North Avenue and 17th Street, operates by completely different rules...

The Poorest Cities in America: What the Census Data Actually Shows
The federal poverty rate for the United States sits at around 12%. The cities on this list are running at two to three times that figure, and most of them have been for decades. These are not cities that hit a rough patch. They are places where concentrated poverty has been the structural reality for a generation or more, driven by deindustrialization, population loss, disinvestment, and the compounding effects of each of those forces on the next...

The Most Extreme Census Tracts in America
Most tracts are unremarkable in the statistical sense - middle of the distribution on income, density, poverty, home values. But the ones at the extremes tell stories that city-level or county-level data can never surface. A tract with 44,000 residents. A neighborhood where the median home value exceeds $2 million. A block where 0% of residents live in poverty. These places exist...

Why So Many People Migrated to the Sunbelt
Between July 2020 and July 2024, the South gained 2,685,000 net domestic migrants, according to Hamilton Zanze's analysis of Census Bureau data. That is not a rounding error. It is the largest sustained regional population shift in modern American history, and...

How Gentrification Rewrote Harlem, Block by Block
Harlem has been called the cultural capital of Black America for more than a century. The Harlem Renaissance of the 1920s and 1930s produced writers, musicians, and artists whose influence still runs through American culture...

How Dallas-Fort Worth Added 4.5 Million People in 35 Years
In 1990, the Dallas-Fort Worth metro area had just under 4 million residents. Today it has 8.5 million. That's not a typo, and it's not a story about one fast decade followed by a plateau. The Dallas metro has added people in every single decade since 1990, at a pace that has no real parallel among large American metros...

Black Monday and What Followed: How Youngstown, Ohio Lost Two Thirds of Its Population
On the morning of September 19, 1977, workers at the Youngstown Sheet and Tube Campbell Works showed up for their shifts and were told the plant was closing. More than 5,000 people lost their jobs that day. Locals called it Black Monday, and the name stuck because what happened next made clear it wasn't just a plant closure. It was the beginning of a decades-long collapse that would cut the city's population by more than half and leave behind one of the most striking examples of urban decline in American history...
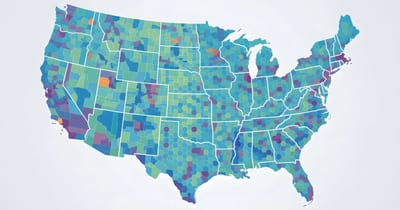
Exploring America by Census Tract - What the Map and Rankings Reveal
The Census Bureau divides the entire United States into 84,000 small statistical neighborhoods called census tracts. Each one covers roughly 1,200 to 8,000 residents, which is close enough to a real neighborhood that the data actually tells you something meaningful about a specific place, not just a city average that smooths over everything interesting. CensusEasy indexes all of them, and we built two tools specifically for people who want to explore the country at that level...

How to Use Census Data to Choose a Neighborhood
Most people choose a neighborhood the same way: they drive around, look at Zillow, maybe check a school rating site, and go with their gut. That process is fine for getting a general feel, but it leaves out a category of information that can matter enormously over a ten or twenty year homeownership horizon. Census data tells you not just what a neighborhood is today, but what direction it's been moving and how fast, and those are the two questions that a Saturday afternoon drive can't answer...

The Best Places to Retire Based on Income, Climate, and Cost
Retirement location decisions come down to three things for most people: how far their money goes, what the weather feels like day to day, and whether the place actually works for someone who isn't commuting to an office anymore. The Census data makes it possible to look...
The 10 Fastest-Growing Cities in America in 2026
Every year researchers and city planners study the same question: which American cities are actually growing, and what is driving them? The answer keeps pointing to the same regions. The Sun Belt, the Mountain West, and a handful of mid-sized metros with strong job markets and enough land to build on. The cities...
Welcome to CensusEasy
Hi, I'm Paul and I've spent years building web platforms around public data, and Census data kept coming up as the most interesting and most underserved category out there. The data itself is remarkable: every city, every ZIP code, every census tract in the country, with population, income, housing, education, and dozens of other metrics going back more than thirty years...