The Most Ethnically Diverse Neighborhoods in America

See more of our coverage in your search results.
In Jamaica Estates-Holliswood in Queens, the population is 28.3 percent Asian, 23.2 percent Black, 22.1 percent White, and 17.0 percent Hispanic. No group is close to a majority and all groups are pretty equally represented. That balance makes it the most ethnically diverse neighborhood in America by our count.
We map 2,360 neighborhoods across 100 cities, built by rolling census tracts up into the names locals actually use, and we score each one on the CensusEasy Diversity Score. The full method is on our methodology page.
The most diverse neighborhoods
| Rank | Neighborhood | City | Score |
|---|---|---|---|
| 1 | Jamaica Estates-Holliswood | New York | 97.4 |
| 2 | Downtown | Los Angeles | 96.9 |
| 3 | Valley High-North Laguna | Sacramento | 96.9 |
| 4 | North Dorchester | Boston | 96.7 |
| 5 | Oxford Circle | Philadelphia | 96.6 |
| 6 | Queensbridge-Ravenswood-Dutch Kills | New York | 96.2 |
| 7 | Metro West | Orlando | 96.1 |
| 8 | Mayfair | Philadelphia | 95.9 |
| 9 | Rosebank-Shore Acres-Park Hill | New York | 95.7 |
| 10 | South Dorchester | Boston | 95.7 |
| 11 | South Ozone Park | New York | 95.4 |
| 12 | North End | St. Paul | 95.3 |
Neighborhoods with at least 10,000 residents.
What the top neighborhoods look like inside
The scores are close enough at the top that the ordering matters less than the shape of the populations underneath. Here is the composition of the first five.
| # | Neighborhood | White | Black | Hispanic | Asian |
|---|---|---|---|---|---|
| 1 | Jamaica Estates-Holliswood | 22.1% | 23.2% | 17.0% | 28.3% |
| 2 | Downtown, Los Angeles | 24.8% | 5.0% | 41.8% | 22.3% |
| 3 | Valley High-North Laguna | 12.4% | 16.9% | 26.9% | 30.0% |
| 4 | North Dorchester | 34.2% | 17.7% | 18.4% | 14.4% |
| 5 | Oxford Circle | 19.1% | 27.1% | 28.0% | 18.1% |
Hispanic is an ethnicity that can be of any race, so rows overlap and do not sum to 100 percent.
Jamaica Estates-Holliswood comes closest to an even four-way split, which is why it scores highest. Oxford Circle in Philadelphia is nearly as balanced. Downtown Los Angeles ranks second despite a 41.8 percent Hispanic plurality because its other three groups are all substantial, and a neighborhood can score well either by being perfectly even or by having four groups that are all present in real numbers.
Queens, Dorchester, and Northeast Philadelphia
Three places show up more than once. New York holds four of the top twelve, and three of those are in Queens, which has been the standard example of American neighborhood diversity for decades and the data supports the reputation. Boston contributes both halves of Dorchester, North at 96.7 and South at 95.7, which together hold nearly 95,000 people. Philadelphia lands Oxford Circle and Mayfair, adjacent neighborhoods in the Northeast section of the city that were heavily white a generation ago and now rank among the most mixed in the country.
Valley High-North Laguna in Sacramento is third, Metro West in Orlando is seventh, and the North End of St. Paul is twelfth. Sacramento in particular has been near the top of diversity measures at every geographic level for years.
Why neighborhoods and not cities
A city-level score averages together neighborhoods that may barely overlap, so a city can look diverse in aggregate while its residents live largely apart. Measuring at the neighborhood level gets closer to the question most people are actually asking, which is whether people of different backgrounds live near each other rather than in the same municipal boundary. That is also why we track a separate segregation score, which measures how evenly groups are spread across the tracts inside a county.
For the larger geographies, see the most diverse cities in America and the county version in how Gwinnett County went from 91 percent white to 30 percent. The reverse trend is in which cities have become less diverse since 2000.
Sources
The Diversity Score is a CensusEasy original index, a Simpson diversity index over the five race and ethnicity shares rescaled from 0 to 100, documented on our methodology page. Neighborhood boundaries are census tracts rolled up into local neighborhood names across 100 cities. Race, ethnicity, and population figures are from the U.S. Census Bureau American Community Survey.
Add CensusEasy as a preferred source on Google to see our stories first.
 GENERAL
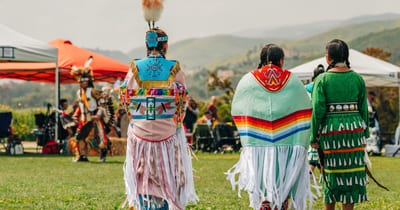
Tribal leaders say the 2030 census plan would erase Native data, and the consultation was rushed
Tribal leaders oppose the proposal to drop race and ethnicity questions from the 2030 census, warning it would erase data on Native communities already undercounted by 5.64 percent on reservations in 2020.
 GENERAL
Lottery ticket sales nearly doubled to $104.7 billion, and states now keep 33 cents of each dollar
State lottery sales rose from $52.8 billion in fiscal 2008 to $104.7 billion in 2024, Census data show. Prizes grew 118 percent, so states kept 33 percent of sales, down from 39 percent.
 GENERAL
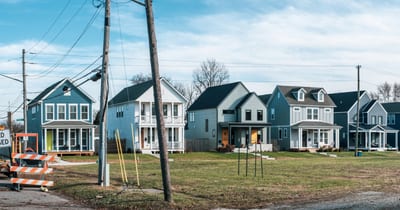
The fastest-gentrifying places in America are small towns, not big cities
Triana, Alabama, went from 499 residents to 3,964 in a decade, and its bachelor's share nearly doubled. Across 6,646 places, 11 of the 12 fastest-gentrifying are towns under 20,000 people.
What is the most ethnically diverse neighborhood in America?
Jamaica Estates-Holliswood in Queens, New York, with a CensusEasy Diversity Score of 97.4. Its population is 28.3 percent Asian, 23.2 percent Black, 22.1 percent White, and 17.0 percent Hispanic, the closest to an even four-way split of any neighborhood with at least 10,000 residents.
Which cities have the most diverse neighborhoods?
New York holds four of the top twelve, three of them in Queens. Philadelphia and Boston each place two, with Oxford Circle and Mayfair in Northeast Philadelphia and both halves of Dorchester in Boston. Sacramento, Los Angeles, Orlando, and St. Paul also appear.
How is neighborhood diversity measured?
The CensusEasy Diversity Score runs 0 to 100 and measures the chance that two randomly chosen residents are of a different race or ethnicity, using the five Census categories. It rewards balance across groups rather than the presence of any one minority population. Neighborhoods are census tracts rolled up into local names across 100 cities, and this ranking is limited to those with at least 10,000 residents.