
US poverty fell to 11.8%, with Louisiana and Mississippi still the highest
About 39.3 million Americans lived below the poverty line in 2025, down from 12.1% of people in 2024. Poverty ran from 18.1% in Louisiana to 6.2% in New Hampshire, and about 1 in 4 children in Louisiana and Mississippi were poor.

See more of our coverage in your search results.
About 39.3 million Americans, or 11.8% of people, lived below the poverty line in 2025, down from 12.1% the year before, according to new Census Bureau estimates.
The figures come from the 2025 American Community Survey 1-year estimates, released October 29. The Census Bureau counts a person as poor when their family's income falls below a threshold that rises with family size. In 2025 that line was $32,649 for two adults and two children and $16,749 for a single adult under 65, according to the Congressional Research Service.
Louisiana (18.1%) and Mississippi (18.0%) had the highest poverty rates, close enough that the survey can't tell them apart. West Virginia (16.0%), Kentucky (15.9%), and the District of Columbia (15.9%) came next.
New Hampshire had the lowest rate, 6.2%, and was the only state clearly below every other. Utah (8.6%), New Jersey (8.7%), Minnesota (9.0%), and North Dakota (9.0%) followed.
The largest states had the most people in poverty: California with 4.4 million, Texas with 3.9 million, New York with 2.7 million, and Florida with 2.6 million.
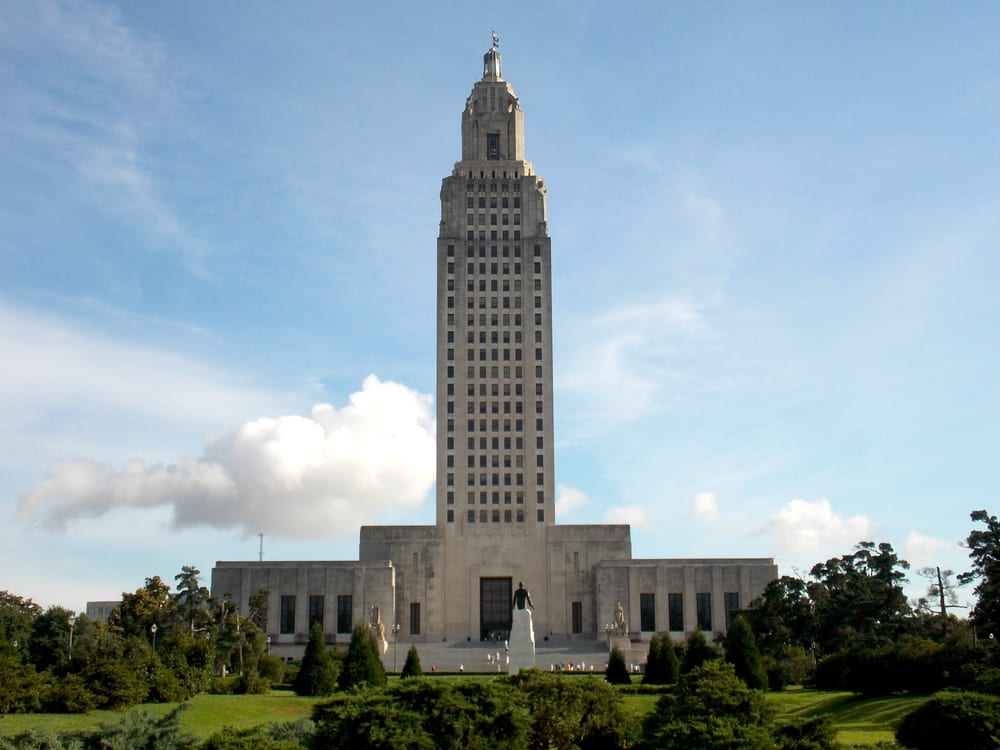
Children were the poorest age group. Nationally, 14.8% of people under 18, about 10.5 million children, lived in poverty, down from 15.5% in 2024. In Louisiana 25.2% of children were poor, and in Mississippi 24.6%, roughly 1 in 4. The rates were lowest in New Hampshire and North Dakota, 7.5% each.
Poverty among people 65 and older held at 11.2%, about 7.1 million people, the same as in 2024. It was highest in the District of Columbia (17.8%), Louisiana (15.5%), and New York (14.1%). Utah and North Dakota were the only states where the estimated poverty rate for older adults topped the rate for children.
Poverty fell significantly in 10 states between 2024 and 2025 and rose in one. The biggest drops came in Rhode Island, from 12.2% to 9.5%, and North Dakota, from 11.1% to 9.0%. Texas, Michigan, Tennessee, Missouri, California, Florida, Connecticut, and New Hampshire also declined. South Dakota was the only state with a significant increase, from 10.4% to 11.8%.
Among cities of 500,000 or more residents, Detroit had the highest poverty rate, 30.4%, followed by Milwaukee (22.9%), Memphis (21.4%), Baltimore (20.9%), and Philadelphia (20.4%). San Jose had the lowest, 7.5%.
College towns led the list of smaller cities. Bloomington, Indiana, home to Indiana University, had the highest rate of any city with 65,000 or more people, 34.7%, and Iowa City, Iowa; Gainesville, Florida; and College Station, Texas, were all at 29% or higher. Students living off campus often report little income of their own, though the survey leaves out students in dorms. At the other end, Apex, North Carolina, a Raleigh suburb, had the lowest rate, 1.9%.
Among counties with 65,000 or more residents, McKinley County, New Mexico, home to part of the Navajo Nation, had the highest rate, 32.3%. Hunterdon County, New Jersey, and Douglas County, Colorado, south of Denver, had the lowest, 3.2% each.
Poverty rate in every state
States are ranked by the share of people living below the poverty line in 2025. Margins of error are at the 90% confidence level. An asterisk marks a 2024 rate that differs significantly from the 2025 rate.
| # | State | Poverty rate | Margin of error | People in poverty | Children | Ages 65+ | 2024 rate |
|---|---|---|---|---|---|---|---|
| 1 | Louisiana | 18.1% | ±0.8 | 812,681 | 25.2% | 15.5% | 18.7% |
| 2 | Mississippi | 18.0% | ±0.7 | 516,582 | 24.6% | 14.0% | 17.8% |
| 3 | West Virginia | 16.0% | ±0.8 | 274,202 | 19.0% | 13.3% | 16.7% |
| 4 | District of Columbia | 15.9% | ±1.9 | 105,481 | 24.5% | 17.8% | 17.3% |
| 5 | Kentucky | 15.9% | ±0.5 | 714,123 | 19.8% | 13.1% | 15.6% |
| 6 | New Mexico | 15.5% | ±0.8 | 324,248 | 19.2% | 13.5% | 16.4% |
| 7 | Arkansas | 15.0% | ±0.7 | 454,985 | 20.1% | 12.8% | 15.5% |
| 8 | Alabama | 14.7% | ±0.6 | 741,146 | 19.8% | 12.0% | 15.2% |
| 9 | Oklahoma | 14.4% | ±0.5 | 577,984 | 18.5% | 11.6% | 14.9% |
| 10 | New York | 13.8% | ±0.3 | 2,686,029 | 17.9% | 14.1% | 14.0% |
| 11 | South Carolina | 13.3% | ±0.5 | 720,328 | 17.6% | 11.3% | 13.3% |
| 12 | Texas | 12.7% | ±0.3 | 3,944,498 | 16.7% | 12.2% | 13.4%* |
| 13 | Michigan | 12.6% | ±0.4 | 1,252,598 | 16.5% | 10.7% | 13.4%* |
| 14 | Tennessee | 12.6% | ±0.4 | 901,438 | 16.5% | 11.5% | 13.5%* |
| 15 | Ohio | 12.4% | ±0.3 | 1,437,642 | 16.4% | 10.7% | 12.7% |
| 16 | Georgia | 12.3% | ±0.4 | 1,355,056 | 16.6% | 12.2% | 12.6% |
| 17 | North Carolina | 12.1% | ±0.4 | 1,316,451 | 15.8% | 10.9% | 12.5% |
| 18 | Indiana | 11.9% | ±0.4 | 807,140 | 15.0% | 9.8% | 12.2% |
| 19 | Arizona | 11.8% | ±0.5 | 880,096 | 14.3% | 10.5% | 11.7% |
| 20 | South Dakota | 11.8% | ±0.9 | 106,660 | 15.1% | 11.0% | 10.4%* |
| 21 | Oregon | 11.7% | ±0.6 | 490,120 | 13.4% | 10.0% | 11.8% |
| 22 | Illinois | 11.5% | ±0.3 | 1,424,283 | 14.2% | 10.5% | 11.6% |
| 23 | Missouri | 11.5% | ±0.4 | 703,944 | 13.7% | 10.9% | 12.3%* |
| 24 | California | 11.4% | ±0.2 | 4,397,101 | 13.8% | 11.9% | 11.8%* |
| 25 | Nevada | 11.4% | ±0.6 | 370,875 | 15.7% | 10.3% | 11.6% |
| 26 | Florida | 11.2% | ±0.3 | 2,563,194 | 13.9% | 12.1% | 12.0%* |
| 27 | Pennsylvania | 11.2% | ±0.3 | 1,419,062 | 14.4% | 10.5% | 11.6% |
| 28 | Montana | 11.1% | ±0.8 | 123,916 | 11.9% | 10.5% | 10.2% |
| 29 | Alaska | 11.0% | ±1.2 | 78,839 | 15.4% | 7.0% | 10.2% |
| 30 | Iowa | 11.0% | ±0.5 | 346,480 | 11.9% | 10.1% | 11.3% |
| 31 | Washington | 10.3% | ±0.4 | 810,880 | 12.7% | 9.9% | 9.9% |
| 32 | Wisconsin | 10.3% | ±0.4 | 598,881 | 12.4% | 10.2% | 10.3% |
| 33 | Kansas | 10.2% | ±0.5 | 294,734 | 11.8% | 9.0% | 10.9% |
| 34 | Nebraska | 10.2% | ±0.7 | 200,232 | 12.1% | 8.8% | 10.9% |
| 35 | Wyoming | 10.1% | ±1.2 | 57,927 | 9.9% | 8.0% | 10.1% |
| 36 | Maine | 9.9% | ±0.6 | 135,814 | 10.7% | 9.9% | 10.6% |
| 37 | Massachusetts | 9.8% | ±0.4 | 679,870 | 11.1% | 10.5% | 9.7% |
| 38 | Idaho | 9.7% | ±0.7 | 192,162 | 11.0% | 9.1% | 10.5% |
| 39 | Maryland | 9.6% | ±0.4 | 590,631 | 12.0% | 10.5% | 9.1% |
| 40 | Delaware | 9.5% | ±1.1 | 98,483 | 11.7% | 8.8% | 9.6% |
| 41 | Rhode Island | 9.5% | ±1.0 | 102,428 | 11.9% | 10.5% | 12.2%* |
| 42 | Virginia | 9.4% | ±0.4 | 812,739 | 11.0% | 9.1% | 9.7% |
| 43 | Hawaii | 9.3% | ±0.7 | 130,762 | 10.9% | 9.4% | 10.0% |
| 44 | Colorado | 9.2% | ±0.4 | 540,905 | 10.0% | 9.8% | 9.6% |
| 45 | Vermont | 9.2% | ±0.8 | 57,320 | 9.9% | 8.5% | 9.0% |
| 46 | Connecticut | 9.1% | ±0.6 | 326,434 | 11.3% | 8.7% | 10.2%* |
| 47 | Minnesota | 9.0% | ±0.4 | 515,019 | 10.0% | 8.1% | 9.3% |
| 48 | North Dakota | 9.0% | ±0.9 | 69,137 | 7.5% | 9.4% | 11.1%* |
| 49 | New Jersey | 8.7% | ±0.4 | 817,486 | 10.6% | 10.0% | 9.2% |
| 50 | Utah | 8.6% | ±0.6 | 300,470 | 8.6% | 10.3% | 8.3% |
| 51 | New Hampshire | 6.2% | ±0.6 | 84,687 | 7.5% | 7.0% | 7.2%* |
Add CensusEasy as a preferred source on Google to see our work first.
Which state has the highest poverty rate?
Louisiana, at 18.1% in 2025, though Mississippi's 18.0% is statistically tied with it, according to the Census Bureau's American Community Survey. West Virginia (16.0%), Kentucky (15.9%), and the District of Columbia (15.9%) were next.
What is the US poverty rate?
About 11.8% of Americans, or 39.3 million people, lived below the poverty line in 2025, according to the American Community Survey. That was down from 12.1% in 2024, a statistically significant drop. Children had the highest rate, 14.8%.
What income counts as poverty in 2025?
The Census Bureau's 2025 poverty threshold was $32,649 for a family of two adults and two children and $16,749 for a single adult under 65. A family counts as poor when its income before taxes falls below its threshold.
Poverty figures come from table S1701, Poverty Status in the Past 12 Months, in the 2025 and 2024 American Community Survey 1-year estimates. A person is counted as poor when their family's total income before taxes falls below the Census Bureau's poverty threshold for a family of that size and makeup; the thresholds are the same nationwide and rise each year with inflation. The survey determines poverty status for most residents but leaves out people in institutions such as prisons and nursing homes, people in military barracks, students living in college dormitories, and unrelated children under 15.
The 1-year estimates are published only for areas with 65,000 or more residents, so the city and county comparisons cover only places of that size. Puerto Rico is excluded. Margins of error are the Census Bureau's 90% confidence figures. Two estimates are treated as statistically different when the gap between them is larger than the square root of the sum of their squared margins of error, which is how the state changes from 2024 to 2025 and the tie between Louisiana and Mississippi were judged.
The American Community Survey's poverty rate differs from the Census Bureau's official national poverty rate, which comes from a smaller survey, the Current Population Survey, and is published each September. The American Community Survey is used for states and local areas because its sample is large enough to produce estimates for them.
You may cite or republish these findings, and the downloadable dataset is licensed under CC BY 4.0. Reuse requires that you credit CensusEasy and link back to this page so readers can verify the underlying data.
CensusEasy Data Team (2026). "US poverty fell to 11.8%, with Louisiana and Mississippi still the highest." CensusEasy. Retrieved from https://censuseasy.com/studies/poverty-rate-by-state
U.S. Census Bureau, 2025 and 2024 American Community Survey 1-year estimates, table S1701 (poverty status in the past 12 months), including margins of error. Congressional Research Service, Poverty in 2025 (IN12737), September 2026, the source of the 2025 poverty thresholds. Full lists are on the highest poverty rate and most people in poverty rankings. Top photo: Capital Area Food Bank, Washington, D.C., by the U.S. Department of Agriculture, via Wikimedia Commons, public domain, cropped to fit. Louisiana photo: 2014 Louisiana State Capitol, by Farragutful, via Wikimedia Commons, licensed CC BY-SA 3.0, resized.


CensusEasy publishes original research grounded in US Census Bureau data. Every study includes the underlying numbers, methodology, and sources so readers can verify or extend the analysis.
Data note. Figures in this report are derived from US Census Bureau and Bureau of Labor Statistics data, including American Community Survey estimates that carry sampling margins of error. This information is provided as is, for general informational purposes, without warranty of accuracy or completeness. CensusEasy is not affiliated with or endorsed by the US Census Bureau or any government agency. See our Terms of Use for details.