
California has more than a quarter of America's electric vehicle households
About 5.5% of U.S. households had an all-electric or plug-in hybrid vehicle in 2025, from 13.8% in California to 1.3% in North Dakota, in the Census Bureau's first survey estimates on electric vehicles.
See more of our coverage in your search results.
About 7.3 million U.S. households had an all-electric or plug-in hybrid vehicle in 2025, and more than a quarter of them were in California, according to the Census Bureau's first survey estimates on electric vehicle ownership.
California's 1.9 million electric vehicle households made up 13.8% of all households in the state, more than twice the national rate of 5.5%. The figures come from the 2025 American Community Survey 1-year estimates, released October 29. The American Community Survey is the Census Bureau's largest yearly survey of households, and this is the first time it has published data on the kinds of vehicles households have.
"Western states have led the way in switching to electric vehicles," said Tricia Holley, a survey statistician at the Census Bureau.
Washington (8.9%), Hawaii (8.5%), and Nevada (8.2%) came next, close enough to one another that the survey can't rank them apart. Vermont and Colorado followed at 7.7% each. North Dakota had the lowest rate of any state, 1.3%, or about 4,500 households, with Wyoming and Louisiana at 1.6% each.
Santa Clara County, California, home to San Jose and most of Silicon Valley, led the 852 counties large enough for the 1-year survey to measure, which are those with at least 65,000 residents. About 24.1% of its households, or roughly 162,500, had an electric vehicle. Marin County, across the Golden Gate Bridge from San Francisco, and San Mateo County, between San Francisco and San Jose, were next at 21.4% each. California counties held 20 of the top 25 spots in the county ranking.
Outside California, the highest rates were in Boulder County, Colorado, home to the University of Colorado (13.9%); Loudoun County, Virginia, in the Washington, D.C., suburbs (13.9%); King County, Washington, which includes Seattle (13.4%); and Douglas County, Colorado, south of Denver (12.6%). The Census Bureau said those four are not statistically different from each other.
Los Angeles County, with about 3.5 million households, had the most electric vehicle households of any county, about 507,500. That's roughly as many as all of Texas, with 492,700, a gap smaller than the survey's margin of error. Florida ranked second among states by count, with about 540,800 electric vehicle households, even though only 5.8% of its households had one. Texas, at 4.2%, was third in the count ranking.
Among cities with at least 65,000 residents, Palo Alto, California, next to Stanford University, had the highest rate at 32.4%. The East Bay suburbs of Dublin (31.4%) and San Ramon (31.0%) were next, then Irvine in Orange County (30.1%) and Pleasanton (29.4%). City estimates carry margins of error of 3 to 5 percentage points, so those five are effectively tied. Sammamish (23.9%) and Bellevue (22.3%), both east of Seattle, had the highest rates outside California.
Among metro areas, the San Jose area led at 23.8%, followed by the San Francisco-Oakland area at 18.0% and Napa at 15.6%. The Los Angeles area, which includes Orange County, had the most electric vehicle households of any metro, about 707,800, and the New York area had about 420,000. Outside California, the Boulder area (13.9%) and the small Heber, Utah, area near Park City (13.5%) had the highest rates.
Homeowners were almost twice as likely as renters to have an electric vehicle, 6.4% of owner households compared with 3.6% of renter households. Owners accounted for 77% of the nation's electric vehicle households, while they make up 65% of all households. In the District of Columbia, owners were more than four times as likely as renters to have one, at 10.8% compared with 2.3%.
Ownership also climbed with income. In the 10 counties where the median household income (the midpoint, with half of households earning more and half less) was above $150,000, 15.1% of households had an electric vehicle. In the 58 counties where it was below $60,000, 2.2% did. The rate rose with each step up in income, and the pattern held with California's counties left out, running from 2.2% in the lowest-income group to 10.1% in the highest.
Electric vehicle ownership in every state
States are ranked by the share of households with at least one all-electric or plug-in hybrid vehicle. Margins of error are at the 90% confidence level. When two states' rates differ by less than their combined margins of error, the survey can't tell them apart.
| # | State | Households with an EV | Margin of error | EV households | Homeowners | Renters |
|---|---|---|---|---|---|---|
| 1 | California | 13.8% | ±0.2 | 1,922,629 | 17.7% | 8.9% |
| 2 | Washington | 8.9% | ±0.3 | 282,512 | 11.2% | 4.9% |
| 3 | Hawaii | 8.5% | ±0.7 | 42,364 | 10.6% | 4.9% |
| 4 | Nevada | 8.2% | ±0.7 | 101,665 | 9.7% | 5.7% |
| 5 | Vermont | 7.7% | ±0.9 | 21,899 | 9.4% | 2.9% |
| 6 | Colorado | 7.7% | ±0.3 | 190,012 | 9.6% | 3.9% |
| 7 | Oregon | 7.4% | ±0.3 | 129,808 | 9.7% | 3.5% |
| 8 | Utah | 6.8% | ±0.4 | 82,361 | 8.4% | 3.2% |
| 9 | New Jersey | 6.6% | ±0.3 | 235,535 | 8.4% | 3.4% |
| 10 | Massachusetts | 6.5% | ±0.3 | 182,635 | 8.4% | 3.2% |
| 11 | Maryland | 6.2% | ±0.3 | 149,818 | 7.5% | 3.4% |
| 12 | Arizona | 6.1% | ±0.3 | 185,773 | 7.5% | 3.4% |
| 13 | Florida | 5.8% | ±0.2 | 540,811 | 6.7% | 3.8% |
| 14 | District of Columbia | 5.6% | ±1.0 | 18,509 | 10.8% | 2.3% |
| 15 | Connecticut | 5.4% | ±0.4 | 78,274 | 6.7% | 2.8% |
| 16 | Virginia | 5.2% | ±0.3 | 181,543 | 6.1% | 3.4% |
| 17 | Delaware | 5.1% | ±0.7 | 21,515 | 5.2% | 4.7% |
| 18 | Rhode Island | 5.0% | ±0.8 | 22,457 | 6.1% | 3.0% |
| 19 | New York | 4.6% | ±0.1 | 362,503 | 6.6% | 2.3% |
| 20 | Illinois | 4.6% | ±0.2 | 236,270 | 5.5% | 2.7% |
| 21 | Georgia | 4.5% | ±0.2 | 193,229 | 5.4% | 2.7% |
| 22 | Texas | 4.2% | ±0.1 | 492,700 | 5.1% | 2.9% |
| 23 | North Carolina | 4.1% | ±0.2 | 186,816 | 4.7% | 2.9% |
| 24 | New Hampshire | 4.1% | ±0.5 | 23,496 | 4.8% | 2.2% |
| 25 | Minnesota | 4.0% | ±0.3 | 95,383 | 4.7% | 2.1% |
| 26 | Michigan | 3.6% | ±0.1 | 148,819 | 4.1% | 2.2% |
| 27 | Idaho | 3.6% | ±0.4 | 27,326 | 4.0% | 2.5% |
| 28 | Pennsylvania | 3.5% | ±0.1 | 190,857 | 4.1% | 2.2% |
| 29 | Maine | 3.4% | ±0.4 | 21,058 | 3.9% | 2.1% |
| 30 | New Mexico | 3.4% | ±0.4 | 28,993 | 3.7% | 2.5% |
| 31 | Wisconsin | 3.3% | ±0.2 | 83,655 | 3.7% | 2.3% |
| 32 | South Carolina | 3.2% | ±0.3 | 73,759 | 3.5% | 2.5% |
| 33 | Nebraska | 3.2% | ±0.4 | 26,269 | 3.2% | 3.1% |
| 34 | Tennessee | 3.2% | ±0.2 | 93,158 | 3.6% | 2.1% |
| 35 | Ohio | 3.1% | ±0.1 | 153,193 | 3.5% | 2.2% |
| 36 | Missouri | 3.0% | ±0.2 | 79,406 | 3.4% | 2.2% |
| 37 | Kansas | 2.9% | ±0.3 | 34,431 | 3.5% | 1.6% |
| 38 | Alaska | 2.8% | ±0.5 | 7,862 | 3.6% | 1.4% |
| 39 | Indiana | 2.6% | ±0.2 | 74,470 | 3.0% | 1.7% |
| 40 | Montana | 2.6% | ±0.5 | 12,475 | 2.7% | 2.3% |
| 41 | Kentucky | 2.5% | ±0.2 | 46,363 | 2.8% | 1.8% |
| 42 | Oklahoma | 2.5% | ±0.2 | 39,635 | 2.8% | 1.8% |
| 43 | Alabama | 2.3% | ±0.2 | 48,492 | 2.4% | 2.1% |
| 44 | Iowa | 2.3% | ±0.2 | 30,515 | 2.6% | 1.4% |
| 45 | Arkansas | 2.2% | ±0.3 | 27,943 | 2.2% | 2.2% |
| 46 | West Virginia | 2.0% | ±0.3 | 14,733 | 2.4% | 0.7% |
| 47 | Mississippi | 1.8% | ±0.3 | 21,608 | 2.1% | 1.2% |
| 48 | South Dakota | 1.8% | ±0.3 | 6,796 | 2.3% | 0.6% |
| 49 | Louisiana | 1.6% | ±0.2 | 30,341 | 1.7% | 1.4% |
| 50 | Wyoming | 1.6% | ±0.5 | 4,163 | 1.8% | 1.2% |
| 51 | North Dakota | 1.3% | ±0.3 | 4,532 | 1.6% | 0.8% |
The District of Columbia, counted alongside the states, had 5.6% of households with an electric vehicle, about 18,500 in all.
Add CensusEasy as a preferred source on Google to see our work first.
Which state has the most electric vehicles per household?
California. In 2025, 13.8% of its households, about 1.9 million, had at least one all-electric or plug-in hybrid vehicle, according to the Census Bureau's American Community Survey. Washington (8.9%), Hawaii (8.5%), and Nevada (8.2%) were next.
How many U.S. households have an electric vehicle?
About 7.3 million, or 5.5% of the nation's 134.1 million households, had at least one all-electric or plug-in hybrid vehicle in 2025. The figures come from the first American Community Survey estimates to report electric vehicle ownership.
Which county has the highest share of electric vehicles?
Santa Clara County, California, home to San Jose and most of Silicon Valley, where 24.1% of households had an electric vehicle in 2025. Outside California, Boulder County, Colorado, and Loudoun County, Virginia, led at 13.9% each.
Electric vehicle figures come from table B25147, Vehicles Available by Electric Vehicles, in the 2025 American Community Survey 1-year estimates. A household counts as having an electric vehicle when at least one of the vehicles kept at home for its members to use is all-electric or a plug-in hybrid. Rates are those households divided by all households (occupied housing units), including households with no vehicle, which matches the Census Bureau's national figure of 5.5%.
The 1-year estimates are published only for areas with 65,000 or more residents, so the county, city, and metro lists cover the 852 counties, about 660 cities, and 530 metro and micropolitan areas the Census Bureau published, not every place. Puerto Rico is excluded. Homeowner and renter rates come from table B25148, which splits the same count by whether the home is owned or rented. County income groups use median household income from table B19013 in the same survey, and each group's rate is its total electric vehicle households divided by its total households.
Margins of error are the Census Bureau's 90% confidence figures. Margins for rates were derived from the published margins for the electric vehicle count and the household total, using the Census Bureau's formula for proportions. Two estimates are treated as statistically different when the gap between them is larger than the square root of the sum of their squared margins of error. Because 2025 is the first year of this data, there is no earlier year to compare with.
You may cite or republish these findings, and the downloadable dataset is licensed under CC BY 4.0. Reuse requires that you credit CensusEasy and link back to this page so readers can verify the underlying data.
CensusEasy Data Team (2026). "California has more than a quarter of America's electric vehicle households." CensusEasy. Retrieved from https://censuseasy.com/studies/electric-vehicle-ownership-by-state
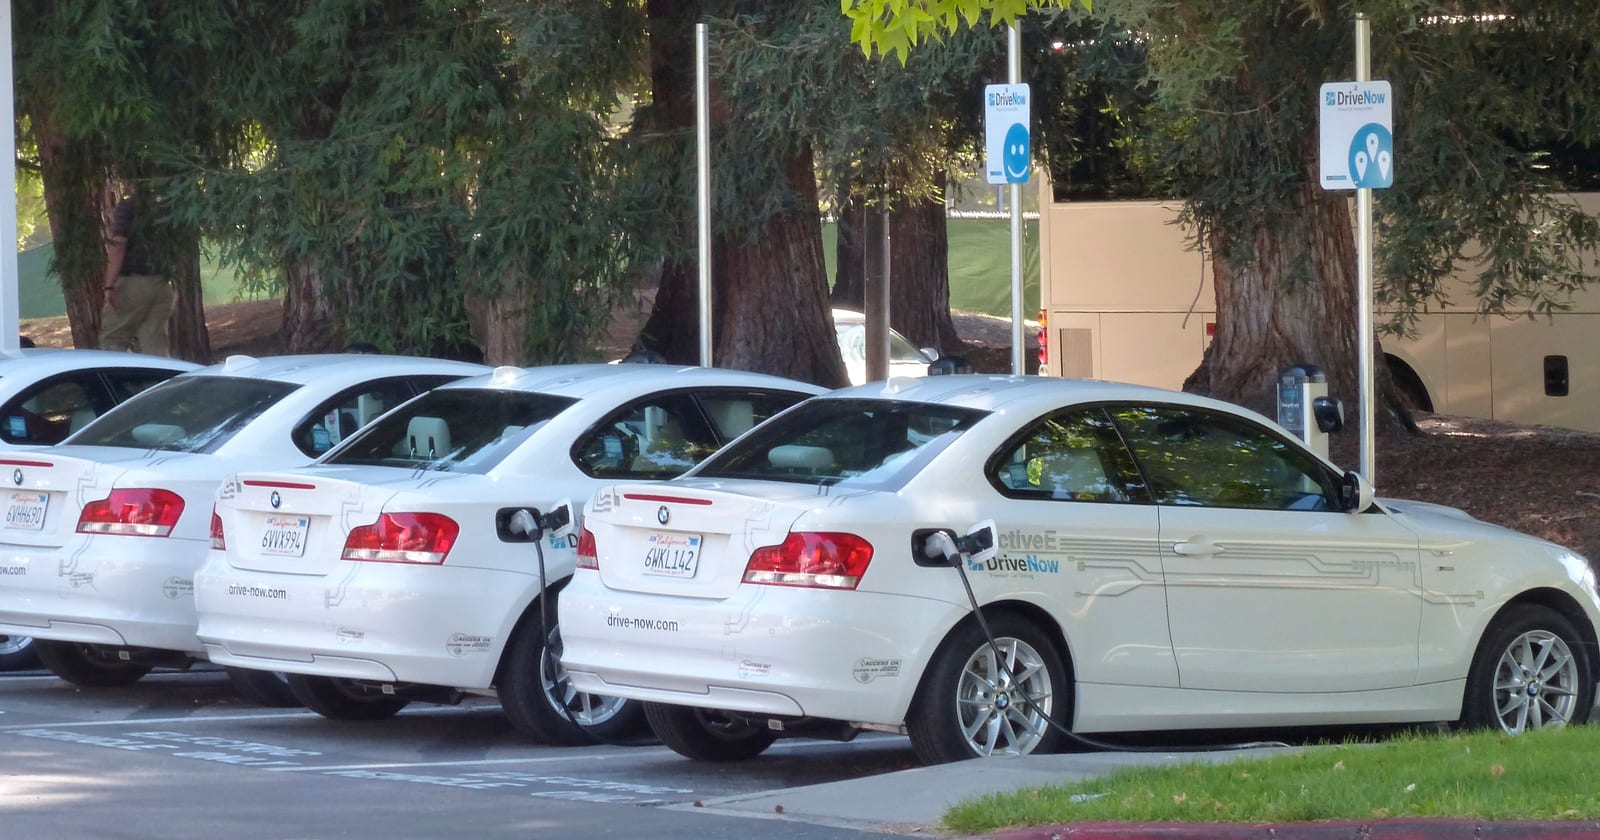
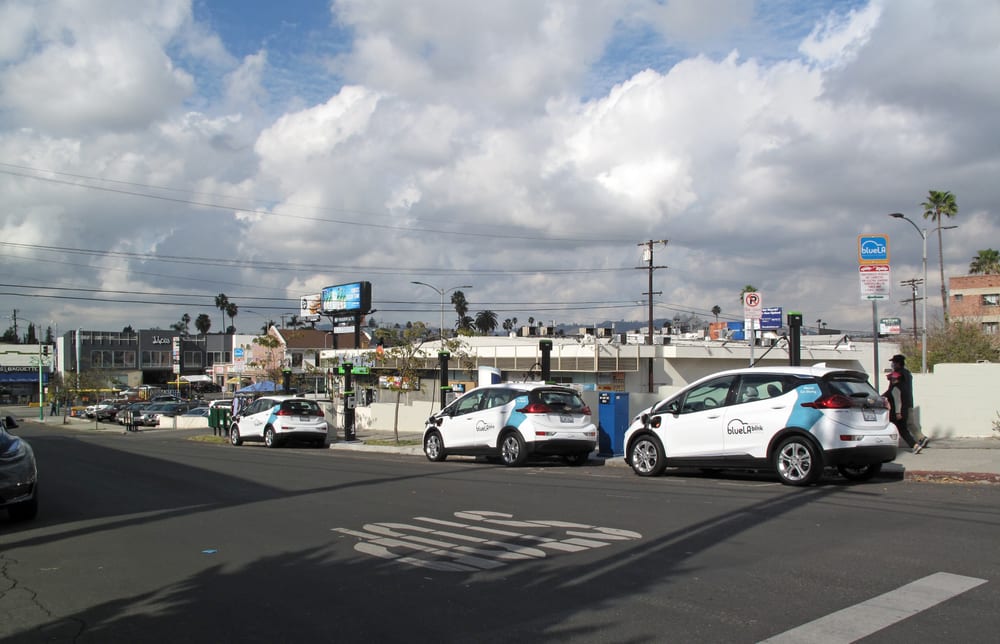
U.S. Census Bureau, 2025 American Community Survey 1-year estimates, tables B25147 (vehicles available by electric vehicles), B25148 (tenure by vehicles available by electric vehicles), and B19013 (median household income), including margins of error. U.S. Census Bureau, Western States Led the Way in Electric Car Adoption, October 29, 2026, the source of the quote from Tricia Holley. Full lists are on the highest electric vehicle ownership and most households with an electric vehicle rankings, each available for states, counties, cities, and metro areas. Top photo: Electric BMWs Charging at Google, by Roman Boed, via Wikimedia Commons, licensed CC BY 2.0, cropped to fit. Koreatown photo: Blue LA charging stations, Koreatown, Los Angeles, by Downtowngal, via Wikimedia Commons, licensed CC BY-SA 4.0, resized.


CensusEasy publishes original research grounded in US Census Bureau data. Every study includes the underlying numbers, methodology, and sources so readers can verify or extend the analysis.
Data note. Figures in this report are derived from US Census Bureau and Bureau of Labor Statistics data, including American Community Survey estimates that carry sampling margins of error. This information is provided as is, for general informational purposes, without warranty of accuracy or completeness. CensusEasy is not affiliated with or endorsed by the US Census Bureau or any government agency. See our Terms of Use for details.