Why So Many People Migrated to the Sunbelt
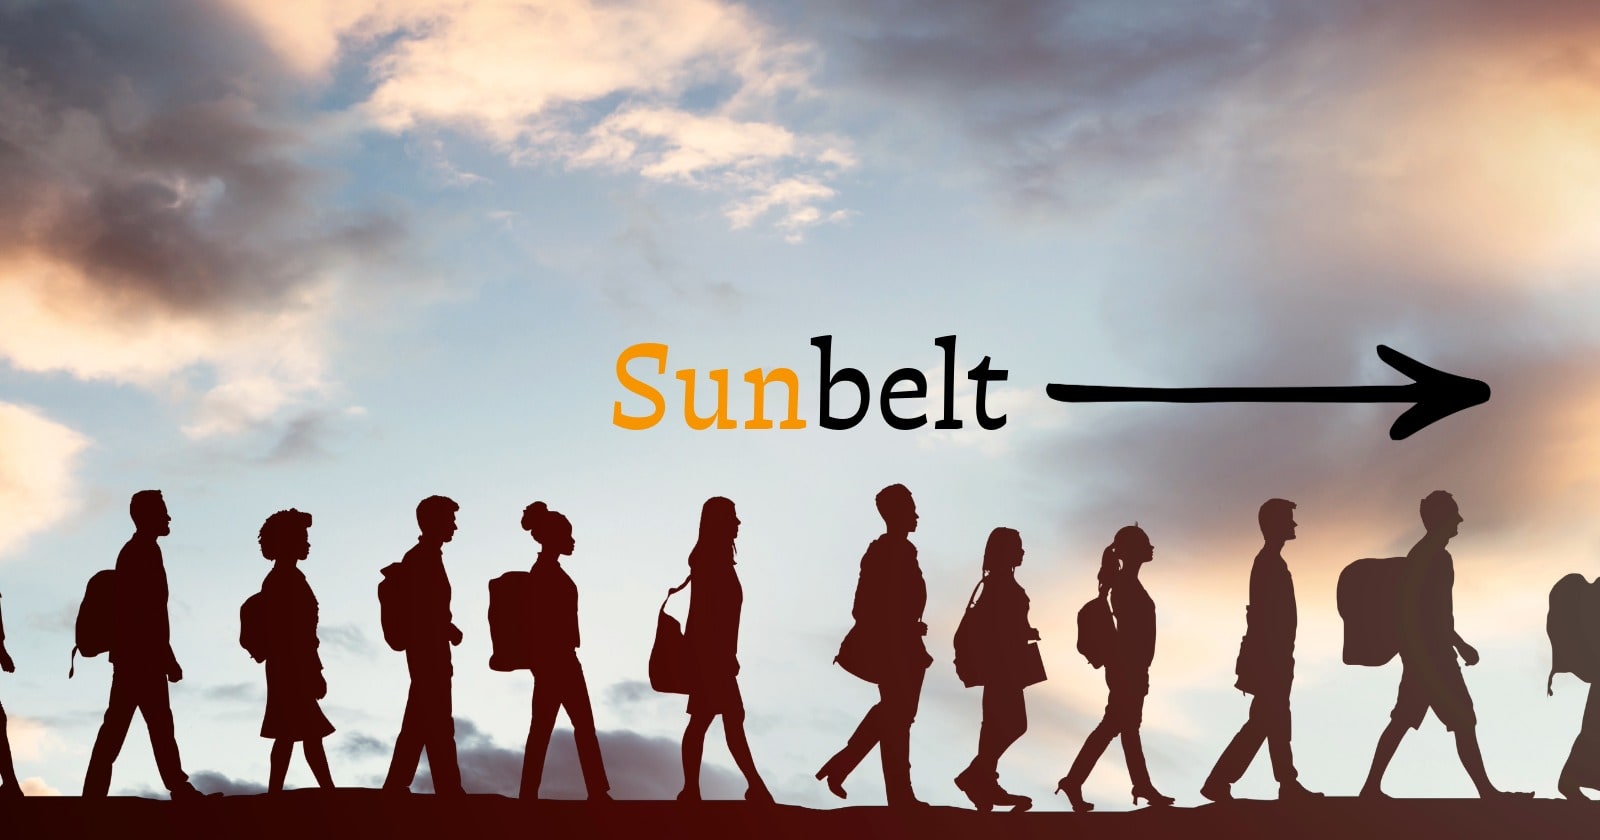
See more of our coverage in your search results.
Between July 2020 and July 2024, the South gained 2,685,000 net domestic migrants, according to Hamilton Zanze's analysis of Census Bureau data. That is not a rounding error. It is the largest sustained regional population shift in modern American history, and it has been building for the better part of eight decades. Understanding why it happened requires going back further than the pandemic, further than the remote work boom, and further than the no-income-tax argument that dominates most coverage of Sun Belt growth.
The migration to the Sun Belt is not one story. It is three overlapping ones, each driven by different forces, each pulling different kinds of people south and west at different moments in American history.
The first wave: federal money and air conditioning (1945 to 1980)
The modern Sun Belt began with World War II and the federal spending that followed it. According to Lumen Learning's US History survey, during the New Deal, President Roosevelt declared the American South the nation's number one economic problem and injected massive federal subsidies into the region. During the Cold War, Sun Belt politicians lobbied aggressively for military installations and defense contracts, and they got them. Aerospace firms in California and Texas, military bases across the Southeast and Southwest, and government research facilities seeded the economic foundation that made the subsequent waves of private investment possible.
The technology factor that rarely gets enough credit in this story is air conditioning. According to HippoCampus US History, an average of 30 million Americans per year changed residences between 1945 and 1975, most of them heading toward Sun Belt states. The mass production of residential air conditioning units, which became widely affordable in the late 1950s and 1960s, transformed the calculus of living in a place that hit 110 degrees in summer. One Arizona migrant quoted in Insider Test Prep's history of the Sun Belt captured the shift: "By the mid-1970s, you'd dash from your air-conditioned car into your air-conditioned office and then go home to a chilled living room. The heat had become a novelty rather than a threat. We traded shoveling snow for staying indoors in July. It seemed like a fair swap."
By 1980, Phoenix had a population of 789,704, making it America's ninth largest city, up from a desert outpost of fewer than 100,000 people in 1950. Miami and Houston were growing at rates that would have seemed implausible to anyone looking at the region in 1940. The federal government had essentially underwritten the infrastructure of an entirely new American region, and air conditioning had made it livable.
The second wave: deindustrialization and the labor cost advantage (1970 to 2000)
As the Rust Belt shed manufacturing jobs through the 1970s and 1980s, the Sun Belt absorbed much of what replaced them, and it did so in part by offering employers something the unionized North could not: lower labor costs and a legal environment hostile to organized labor. According to the Lumen Learning survey, the Taft-Hartley Act of 1949 had facilitated Southern states' right-to-work laws, and cheap, non-unionized labor pulled major industries southward and westward. Workers followed the jobs.
The housing cost differential amplified everything. A migrant from San Francisco quoted in the same Insider Test Prep piece described purchasing a ranch-style house in Scottsdale, Arizona for a price that would have "barely gotten us a studio apartment back in San Francisco," adding that in the Sun Belt, "a middle-class guy could live like a king on a modest paycheck." That dynamic attracted not just retirees and blue-collar workers but the growing professional class that had priced themselves out of coastal cities. The tax environment reinforced it: multiple Sun Belt states had no income tax, and property taxes on modest homes were a fraction of what comparable households paid in the Northeast.
By the 1990s, Atlanta had become a major corporate and financial hub. Charlotte was growing into a significant banking center. Raleigh and the Research Triangle were pulling pharmaceutical and technology employers. The Sun Belt was no longer just cheap land and mild winters. It was developing the professional infrastructure that could retain and grow a high-skilled workforce.
The third wave: remote work, equity extraction, and the pandemic shock (2020 to today)
The first two waves built slowly over decades. The third wave happened in roughly eighteen months. When remote work normalized in 2020, it decoupled income from location for a significant share of the professional workforce for the first time in American history. A software engineer earning a San Francisco salary no longer needed to live in San Francisco. A financial analyst earning a New York wage no longer needed to pay New York rent.
The Sun Belt was the primary beneficiary. According to Hamilton Zanze's analysis, the Southeast in particular dominated net domestic migration between 2023 and 2024, with 14 of the 15 highest net in-migration rates among the country's 100 largest metros located in the Southeast, from the Carolinas to Northwest Arkansas. According to the George W. Bush Presidential Center's analysis, these included Raleigh and Charlotte in North Carolina, Charleston and Greenville in South Carolina, Knoxville and Chattanooga in Tennessee, and Jacksonville, Florida.
The mechanism was partly tax and partly housing math. A household selling a three-bedroom home in the Bay Area or the New York suburbs in 2020 and 2021 was often walking away with $800,000 to $1.5 million in equity. Deploying that equity into a Sun Belt market where comparable or larger homes cost $350,000 to $500,000 left the household with significant cash and a dramatically lower cost of living, even accounting for the loss of a coastal-market salary if one partner stopped working or took a lower-paying local job.
The Census data captures what this looked like on the ground. The Phoenix metro, the Tampa metro, and the Atlanta metro all saw some of their largest single-year population gains on record between 2020 and 2022. The Raleigh metro and the Orlando metro similarly posted growth numbers that would have been exceptional in any prior decade.
What has slowed it down
The third wave has moderated significantly since its 2021 and 2022 peak, and the reasons are worth understanding because they reveal the limits of the Sun Belt's growth model. According to the Bush Presidential Center analysis, slowdowns in Florida and Texas reflect the home price appreciation those states experienced over the past decade and their resulting loss of affordability relative to other Sun Belt states. Texas and Florida were the primary beneficiaries of the first pandemic wave precisely because they were cheap. By 2023 they were significantly less cheap, and migrants who might have chosen Austin or Miami in 2020 were choosing Raleigh or Chattanooga instead.
Immigration has also become a more complicated factor in Sun Belt growth projections. According to Brookings, as domestic migration to Sun Belt metros softened in the post-pandemic period, immigration had been helping them maintain growth levels. But the Census Bureau projects that net immigration could fall from 1.3 million annually to around 321,000 in the year ending June 2026, following the stricter enforcement policies of the Trump administration. For metros like Miami and Houston where immigration has been a significant share of total population growth, that shift matters.
The structural advantages that remain
None of the factors that moderated the pandemic-era boom have reversed the underlying structural advantages that drove the first two waves. The Sun Belt still offers no-income-tax environments in Texas, Florida, Tennessee, and Nevada. Housing costs in cities like Charlotte, Raleigh, San Antonio, and Atlanta remain well below comparable metros in the Northeast and on the West Coast. The climate appeal is unchanged. And the corporate infrastructure built up over seventy years of growth, including the airports, universities, medical systems, and professional service ecosystems that make a region viable for large employers, is not going anywhere.
The question for the next decade is whether the leading Sun Belt metros can continue growing without repeating the affordability collapse that eventually slowed the first-wave cities like Los Angeles and San Francisco. The cities that managed the transition best in the 2000s and 2010s were the ones with the most responsive housing supply: the ones that approved new construction quickly enough to absorb demand without letting prices spiral out of reach for the middle-income households whose migration had powered the growth in the first place. The Census data will keep measuring the answer city by city and decade by decade.
Add CensusEasy as a preferred source on Google to see our stories first.
 BOOMTOWNS
The Fastest-Growing Counties in Texas, 2024 to 2025
Texas added 391,243 residents in a single year. Harris County led in raw numbers, but the fastest growth was in the exurban collar counties, with Kaufman County landing near the top of both the numeric and percentage rankings.
 BOOMTOWNS
Houston Overtakes Dallas as America's Fastest-Growing Metro
The Houston metro added 126,720 people from 2024 to 2025, the most of any U.S. metro area and just ahead of Dallas-Fort Worth, according to new Census Bureau estimates.
 BOOMTOWNS
Atlanta vs. Charlotte: The Southeast's Two Biggest Growth Stories
Atlanta and Charlotte are the two cities that defined the Southeast's rise as an economic region over the past 35 years. Both started the 1990s as mid-sized Southern cities with regional profiles and have grown into nationally significant metros with Fortune 500 headquarters, major financial sectors, and...
Why are so many people moving to the Sun Belt?
People are moving to the Sun Belt because of lower housing costs, warmer weather, no-income-tax states, job growth, remote work flexibility, and decades of corporate and federal investment.
How did remote work change Sun Belt migration?
Remote work accelerated Sun Belt migration by letting higher-income workers keep coastal salaries while moving to cheaper metros like Phoenix, Tampa, Atlanta, Raleigh, and Orlando.
Is Sun Belt migration slowing down?
Yes, the pandemic-era surge has moderated as Florida and Texas became less affordable, pushing some migrants toward cheaper Sun Belt metros in the Carolinas, Tennessee, and other interior markets.