The Most Expensive Neighborhoods in America
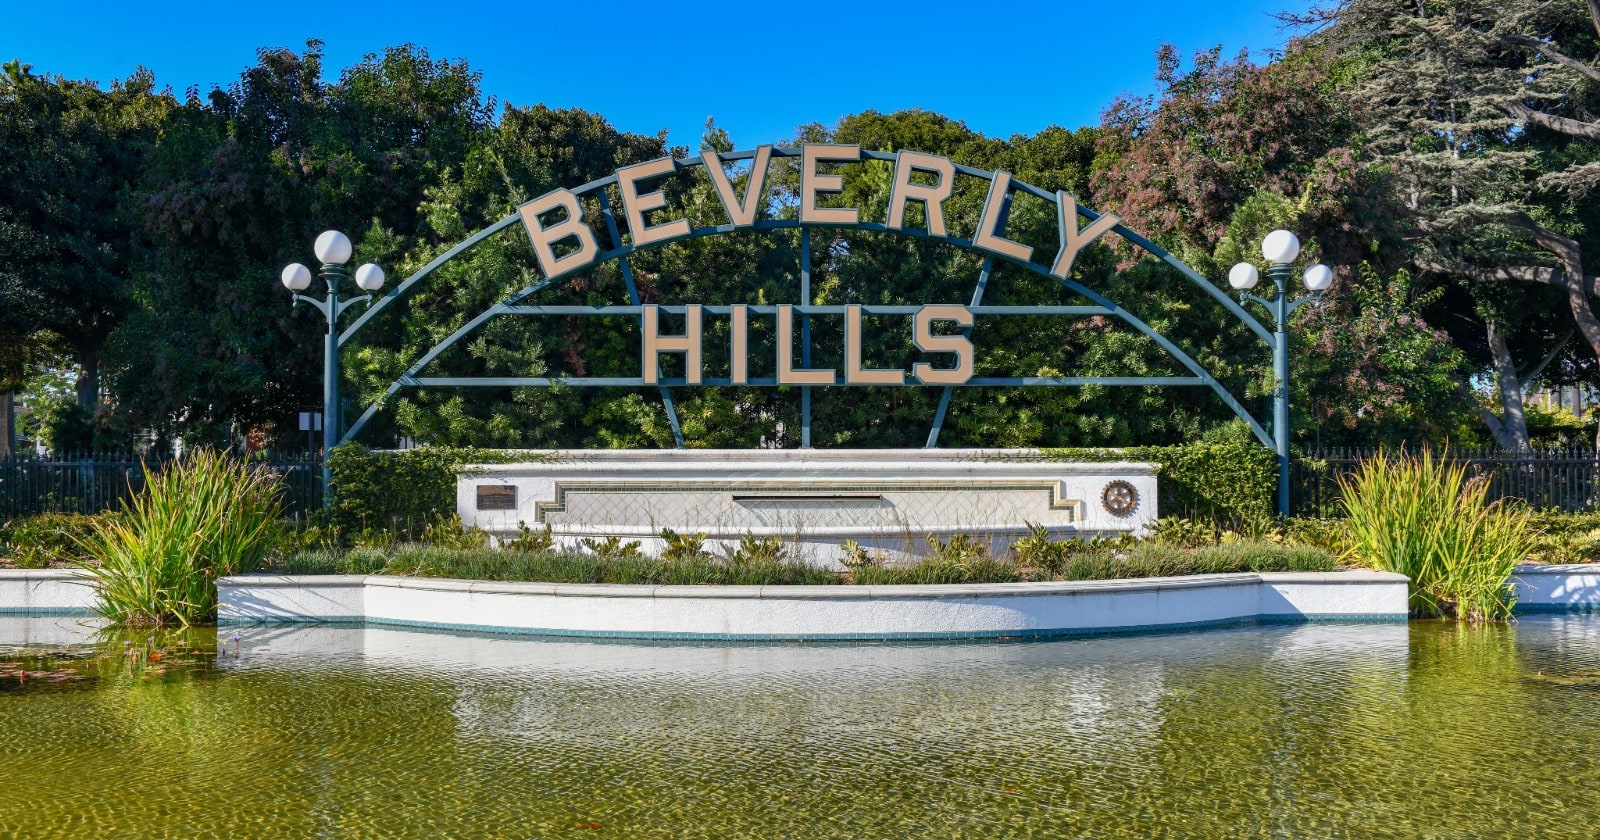
See more of our coverage in your search results.
If you ask someone to name the richest neighborhood in America and they'll usually reach for a zip code in Manhattan, Beverly Hills, or maybe a hedge-fund town in Connecticut. When you rank all 2,360 neighborhoods CensusEasy maps across 100 cities by median household income, the top of the list is a mix of leafy suburbs-within-cities and a few coastal enclaves, and several of them are tied at the exact same number. Why the exact same number? I'll explain why first before we go any further.
The ceiling problem: why the richest places all tie at "$250,000+"
The Census Bureau caps reported household income at $250,000 in this data. That's called top-coding. If a neighborhood's median household earns more than a quarter-million dollars, the Bureau records it only as "$250,000+". The same thing happens with home values, which top out at $2,000,000+. So when you see a neighborhood sitting at one of those two numbers, read it as "at least this much," not "exactly this much."
This is why Montclair in Oakland and Spring Valley in Washington DC are technically tied for first at $250,000+. Their actual medians are almost certainly different, and probably higher, but the data the Census Bureau reports can't tell us by how much. Montclair's median home value lands at $1,549,011 across about 8,080 residents. Spring Valley's homes are pricier at $1,976,453, with 6,701 people. If I had to bet, Spring Valley is the wealthier of the two, but the income figure won't confirm it.
The actual ranking, with a caveat
Once you get past the top-coded ties, the numbers start to separate. Here's how the wealthiest neighborhoods stack up by reported median household income:
Montclair, Oakland and Spring Valley, DC both hit the $250,000 ceiling. After them comes American University Park in Washington DC at $239,800, with a median home value of $1,286,362 and a population of 6,932. Then Kimber-Gomes in Fremont, California at $237,326, where homes run $1,897,598 across 8,031 people.
Myers Park in Charlotte follows at $234,603, and it's the largest of the bunch with 12,117 residents and a median home value of $1,488,222. Brookhaven in Atlanta comes in at $231,507, with the most affordable homes on this list at $1,112,034 and a small population of 4,749. North City in San Diego sits at $224,818, homes at $1,672,178, population 13,853.
Then two of the most famous addresses in the country show up, and both bump into the home-value ceiling. Tribeca-Civic Center in New York reports a median household income of $224,228 with median home value pinned at the $2,000,000 cap, and a population of 22,563, by far the densest on the list. Cow Hollow in San Francisco is right behind at $222,286, home value also at the $2,000,000 ceiling, 8,693 residents. Rounding out the top ten, Almaden Valley in San Jose at $214,884, homes at $1,699,025, and a sprawling population of 43,134.
One thing jumps out looking at this. Six of the top ten are in California, and the home values there often outrun the income figures. Cow Hollow households report $222,286 but live in homes the data can't even fully measure. That usually means old money, inherited property, or owners who bought decades ago and are sitting on enormous unrealized value.
The other end of the list
The same data that caps the rich at a ceiling lets the poorest neighborhoods fall as far as the numbers go. The lowest median household income in the entire 2,360-neighborhood set belongs to South Cumminsville in Cincinnati at $10,853, across 5,856 residents. It is the neighborhood-level face of a pattern we track at the city scale in the poorest cities in America. That's not a typo and it's not top-coded. It's a real number, and the distance between it and Montclair's ceiling is more than $239,000.
Close behind is Hogan's Creek in Jacksonville at $13,931, population 5,964. Cleveland holds two of the next spots: Central at $18,036 with 10,324 people, and Hough at $21,679 with 10,288. These are larger neighborhoods than most of the wealthy ones, which is a pattern worth noticing: concentrated low income tends to come with concentrated population.
Watch out for the student trap for "poor neighborhoods"
Some of the "poorest" neighborhoods by household income aren't poor in the structural sense at all. They're full of college students.
Take Fort Sanders in Knoxville, which reports a median household income of $17,206. That would put it among the poorest places in the country, except it sits next to the University of Tennessee and is packed with students living on loans, part-time jobs, and parental support. The household income number is real, but it describes a stage of life, not a trapped community. Same story with West University in Austin at $21,854, which surrounds the University of Texas.
A 21-year-old undergrad with $20,000 of reported income and a graduating senior in South Cumminsville show up identically in the income column. They are not living the same reality. When you read these rankings, check whether a low number sits next to a campus before you draw any conclusion about hardship.
What the spread actually tells us
Even with the rich artificially compressed at $250,000, the wealthiest neighborhoods report more than 23 times the income of the poorest. The real multiple is larger, because the top is capped and the bottom isn't. And these aren't different countries or even different states in many cases. They're census tracts inside the same 100 cities, sometimes a short drive apart.
The other quiet finding is geographic. Wealth clusters on the coasts and in a handful of Sun Belt enclaves like Myers Park and Brookhaven, while the deepest income lows show up in older industrial Midwest cities, Cincinnati and Cleveland especially. That's not destiny, but it's a clear pattern in the data, and it holds across the full neighborhood set.
CensusEasy maps neighborhoods like these across 100 cities, rolling up census tracts into the names locals actually use. If you want to see where your own city's blocks fall on this spread, pull up its neighborhoods and look at the income column with the top-coding in mind. And if you're trying to settle an argument about two places, the compare tool puts them side by side so you can see the numbers instead of trading guesses.
Sources
Data comes from the U.S. Census Bureau American Community Survey (latest 5-year estimates), rolled up into neighborhood-level figures by CensusEasy neighborhood data.
Add CensusEasy as a preferred source on Google to see our stories first.
 GENERAL
Black household income rises 76% since 1967, but dollar gap with White households widens
Census figures back to 1967 show Black median household income up 76.2 percent after inflation, to $59,980. The ratio to non-Hispanic White income narrowed, but the gap in dollars grew to $36,730.
 GENERAL
These U.S. counties have the highest housing vacancy rates, but they're not abandoned
Sixty-one percent of housing in Summit County, Colorado is vacant. That's Breckenridge, not a ghost town. Every county at the top of the vacancy list is a vacation destination.
 GENERAL
The area codes with the most people
Hawaii's 808 is the most populous area code covering a whole state, with 1.43 million residents. Arizona averages 1.5 million people per code. Here is every state's area codes and residents per code.
Why are the richest neighborhoods all tied at $250,000?
The Census Bureau top-codes household income at $250,000 in this data. Any neighborhood whose median household earns more than that is recorded only as "$250,000+", so the wealthiest enclaves like Montclair in Oakland and Spring Valley in DC tie at the ceiling even though their true medians differ. Read those figures as 'at least this much,' not exact.
What is the poorest neighborhood in the data?
South Cumminsville in Cincinnati has the lowest median household income at $10,853 across about 5,856 residents. Hogan's Creek in Jacksonville follows at $13,931, with Central ($18,036) and Hough ($21,679) in Cleveland close behind. Unlike the top of the list, these numbers are not capped, so the true gap with the wealthiest areas is even larger.
Why do some poor-looking neighborhoods turn out to be student areas?
Neighborhoods next to large universities can post very low median household incomes because they are full of students living on loans and part-time work. Fort Sanders in Knoxville ($17,206) sits by the University of Tennessee, and West University in Austin ($21,854) surrounds the University of Texas. That reflects a stage of life, not structural poverty, so check for a nearby campus before drawing conclusions.