The Poorest Cities in America: What the Census Data Actually Shows

See more of our coverage in your search results.
The federal poverty rate for the United States sits at around 12%. The cities on this list are running at two to three times that figure, and most of them have been for decades. These are not cities that hit a rough patch. They are places where concentrated poverty has been the structural reality for a generation or more, driven by deindustrialization, population loss, disinvestment, and the compounding effects of each of those forces on the next.
The CensusEasy poverty rankings cover more than 6,800 cities, but the top of that list is dominated by college towns where student populations artificially inflate poverty rates. Oxford, Ohio has a 45% poverty rate because Miami University of Ohio enrolls roughly 16,000 students who report little or no income. That is a different phenomenon from what is happening in Flint, Michigan. This article focuses on cities with populations over 20,000 where the poverty is structural, not statistical - places where the data reflects real economic hardship rather than the particular way the Census counts full-time students.
Hamtramck, Michigan: 39.9%
Hamtramck is a small city of 27,000 people completely surrounded by Detroit, and it has one of the highest poverty rates of any non-university city in the country at 39.9%. Median household income is $39,293, median home value is $131,000, and the median age of 26.5 is the lowest of any city on this list, reflecting a large and young immigrant population that has made Hamtramck demographically unusual even within Michigan. The city shifted from a majority Polish-American community to a majority Muslim, largely Yemeni and Bangladeshi immigrant community over the past three decades, and in 2021 it became the first city in the United States to elect an all-Muslim city council. The poverty rate reflects the economic position of recently arrived immigrant households rather than the generational disinvestment story that characterizes most of the cities below it on this list, which makes Hamtramck a different kind of poverty case even at the same headline number.
Flint, Michigan: 34.1%
Flint is probably the most recognizable city on this list for reasons that go beyond poverty. The water crisis that emerged in 2014 and 2015, when the city's water supply was found to contain dangerous levels of lead following a cost-cutting decision to switch water sources, put Flint in international headlines and became a symbol of what happens when poverty concentrates long enough to erode a city's political and institutional capacity to protect its own residents. The poverty rate of 34.1% and median household income of $37,646 reflect decades of decline from the city's peak as one of General Motors' most important manufacturing centers. Median home value is $53,500, the second lowest on this list, meaning the housing stock has essentially no market value in a city where there is more supply than demand and where the contamination crisis accelerated an already accelerating departure of residents who could leave. According to the Census Bureau, Flint's population peaked at 196,940 in 1960 and has since fallen to under 80,000.
Gary, Indiana: 33.1%
Gary was built around U.S. Steel's Gary Works, which opened in 1906 and was for decades one of the largest steel plants in the world. The city's population peaked at 178,320 in 1960 and has fallen every decade since, reaching 67,289 today. Poverty is 33.1%, median household income is $38,731, and the median home value of $94,700 reflects a market where entire blocks have been abandoned and demolished. Gary's decline mirrors Youngstown's in most respects, with the steel industry collapse of the 1970s and 1980s as the central event and decades of compounding disinvestment following it. According to Indiana University Northwest's analysis of Gary's decline, white flight accelerated sharply after the election of Richard Hatcher as the city's first Black mayor in 1967, removing the tax base at the exact moment the industrial base was beginning to weaken.
Detroit, Michigan: 32.7%
Detroit is the largest city on this list at 649,095 residents and carries a poverty rate of 32.7%, meaning roughly one in three residents lives below the federal poverty line in a city that was once the wealthiest per capita in the United States. Median household income is $39,938, median home value is $83,900. Detroit's 2013 municipal bankruptcy was the largest in American history at the time, and the city has been in a slow recovery since then, with investment concentrated in the downtown core and Midtown while large swaths of the residential city remain depopulated. According to Brookings, the city lost more than 60% of its population between 1950 and 2010, leaving behind an infrastructure designed for 1.8 million people that now serves fewer than 650,000. The tax base cannot support the services the remaining population needs, and that gap has been the defining fiscal challenge of the city's government for more than thirty years.
Atlantic City, New Jersey: 32.3%
Atlantic City is the outlier on this list because its poverty is not primarily a legacy of deindustrialization. It is a casino economy failure. The city legalized gambling in 1976 with the specific intention of using casino revenue to revitalize a declining resort town, and for a period it worked, making Atlantic City the second-largest gambling market in the country after Las Vegas. Then the regional gambling market fragmented as states across the Northeast legalized their own casinos and online gambling began diverting revenue. Between 2012 and 2016, five of Atlantic City's twelve casinos closed, eliminating thousands of jobs in a city where the casino economy was essentially the entire economy. The poverty rate of 32.3% and median household income of $41,028 reflect the aftermath. The median home value of $207,400 is the highest on this list, inflated by the beachfront location and the legacy of casino-era investment, but it exists alongside a poverty rate that places the city among the most distressed in the Northeast.
Camden, New Jersey: 30.2%
Camden sits across the Delaware River from Philadelphia and has been one of the most consistently poor cities in America for decades. Poverty is 30.2%, median household income is $40,546, median home value is $112,000. Like Detroit and Gary, Camden's decline traces to the collapse of its industrial base, which included shipbuilding, manufacturing, and the RCA Victor plant that once employed thousands of the city's residents. According to reporting by the New York Times, Camden was ranked the most dangerous city in the United States multiple times in the 2000s, and in 2013 the city dissolved its municipal police force and replaced it with a county-run department in a radical governance experiment that attracted national attention. Crime rates have fallen significantly since, but the economic fundamentals have not recovered.
Cleveland, Ohio: 30.6%
Cleveland peaked at 914,808 residents in 1950 and has fallen to 363,608, a loss of roughly 60% of its population over seventy years. The poverty rate of 30.6% and median household income of $40,801 place it squarely in the deindustrialized Midwest tier alongside Detroit, Gary, and Youngstown. Median home value is $102,000. Cleveland has had more success than some of its Rust Belt counterparts in anchoring a post-industrial economy around healthcare and higher education, with the Cleveland Clinic and Case Western Reserve University providing stable high-employment anchors in the university circle area. But that success has been geographically concentrated, and the city's residential neighborhoods outside the healthcare and education corridor carry poverty rates that look much like the citywide average or worse.
Rochester, New York: 27.8%
Rochester was once the headquarters of Eastman Kodak, Xerox, and Bausch and Lomb - three Fortune 500 companies in a city of 200,000 people, a concentration of corporate employment that was extraordinary by any measure. Kodak alone employed 60,000 people in Rochester at its peak. The digital photography revolution that Kodak failed to navigate, despite having invented the digital camera itself, eliminated most of those jobs over two decades. Poverty today is 27.8%, median household income is $47,213, and median home value is $139,600. Rochester's case is particularly stark because the transition from a high-wage manufacturing and corporate economy to whatever replaced it has left a large share of the population without the credentials or skills the post-industrial economy values, and the concentration of poverty in the city's residential neighborhoods has persisted across multiple cycles of attempted revitalization.
Reading, Pennsylvania: 28.7%
Reading had a poverty rate of 41.3% in 2011, making it briefly the poorest city of its size in the country, a distinction it has since partially recovered from but not escaped. Today the rate is 28.7%, median household income is $44,091, and median home value is $121,300. The city's decline followed the standard Rust Belt trajectory: textile and manufacturing industries that employed much of the working-class population through the mid-twentieth century contracted and left, the tax base shrank, and a large Puerto Rican migration that arrived when industrial jobs were still available became concentrated in poverty after those jobs disappeared. According to NPR's coverage of Reading's poverty crisis, the city's location between Philadelphia and Allentown made it a landing point for migrants seeking affordable housing but limited its ability to attract the kind of institutional anchors that have stabilized other struggling cities.
Buffalo, New York: 26.0%
Buffalo is the largest city in upstate New York and one of the most improved on this list in recent years, with a poverty rate that has come down from above 30% a decade ago to 26.0% today. Median household income has reached $50,041 and median home value $164,200, both figures reflecting modest but real improvement. The city has benefited from significant state investment in its medical corridor and from a wave of refugee resettlement that has brought new residents and economic activity to neighborhoods that were emptying out. It remains a city with serious structural challenges - it peaked at 580,132 residents in 1950 and has fallen to 274,613 - but its trajectory is more positive than most cities on this list.
What drives persistent poverty in American cities
Look across this list and the pattern is consistent enough to call it a formula. A city builds its economy around a single dominant industry - steel in Gary and Youngstown, automobiles in Detroit and Flint, manufacturing in Camden and Reading, film in Rochester, gambling in Atlantic City. That industry contracts sharply over a compressed period, eliminating the tax base and the employment base simultaneously. The households that can leave do, taking their income and wealth with them and leaving behind a population that is disproportionately older, poorer, and less mobile. The remaining tax base cannot fund the services the remaining population needs, which makes the city less attractive to new investment, which accelerates the departure of anyone with options. The cycle compounds.
The cities that have interrupted that cycle most effectively, like Buffalo, have done so by attracting institutional anchors - universities, hospitals, government facilities - that provide stable employment regardless of what the private economy is doing, and by accepting large numbers of new residents, including immigrants and refugees, who bring population and economic activity to neighborhoods that would otherwise continue to empty out.
The full ranking of highest-poverty cities, filterable by state and population threshold, is available on the CensusEasy rankings page. You can explore any city's full historical poverty data from 1990 to today using the Compare tool.
Add CensusEasy as a preferred source on Google to see our stories first.
 DECLINE
The Fastest-Shrinking Cities in America
The fastest-shrinking large cities split into two very different stories: people priced out of the expensive coasts, and the long structural decline of the South and Midwest. Here is why you shouldn't read them as the same trend.
 DECLINE
How Detroit Lost Half Its Population, and Why It Is Finally Growing Again
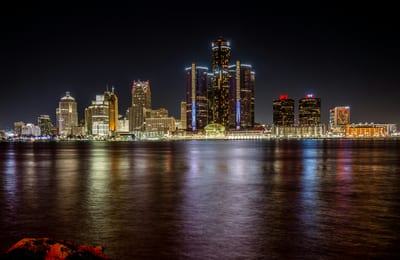
Detroit had more than a million residents in 1990 and 1.85 million at its 1950 peak. By 2024 it had fallen to 638,000, one of the steepest urban declines in American history. But the latest Census numbers show something that has not happened in 70 years: the population went up.
 DECLINE
Black Monday and What Followed: How Youngstown, Ohio Lost Two Thirds of Its Population
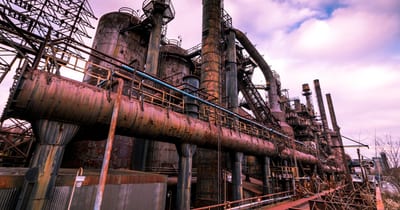
On the morning of September 19, 1977, workers at the Youngstown Sheet and Tube Campbell Works showed up for their shifts and were told the plant was closing. More than 5,000 people lost their jobs that day. Locals called it Black Monday, and the name stuck because what happened next made clear it wasn't just a plant closure. It was the beginning of a decades-long collapse that would cut the city's population by more than half and leave behind one of the most striking examples of urban decline in American history...
Which major US cities have some of the highest poverty rates?
Hamtramck, Flint, Gary, Detroit, Atlantic City, Camden, Cleveland, Rochester, Reading, and Buffalo are among the high-poverty cities highlighted in the article.
Why do so many Rust Belt cities have high poverty rates?
Many Rust Belt cities have high poverty because manufacturing collapsed, population fell, the tax base shrank, and disinvestment compounded over decades.
Why are college towns excluded from structural poverty rankings?
College towns can show inflated poverty rates because full-time students often report little income, which is different from long-term economic hardship in cities like Flint or Gary.