New Jersey is America's densest state
See more of our coverage in your search results.
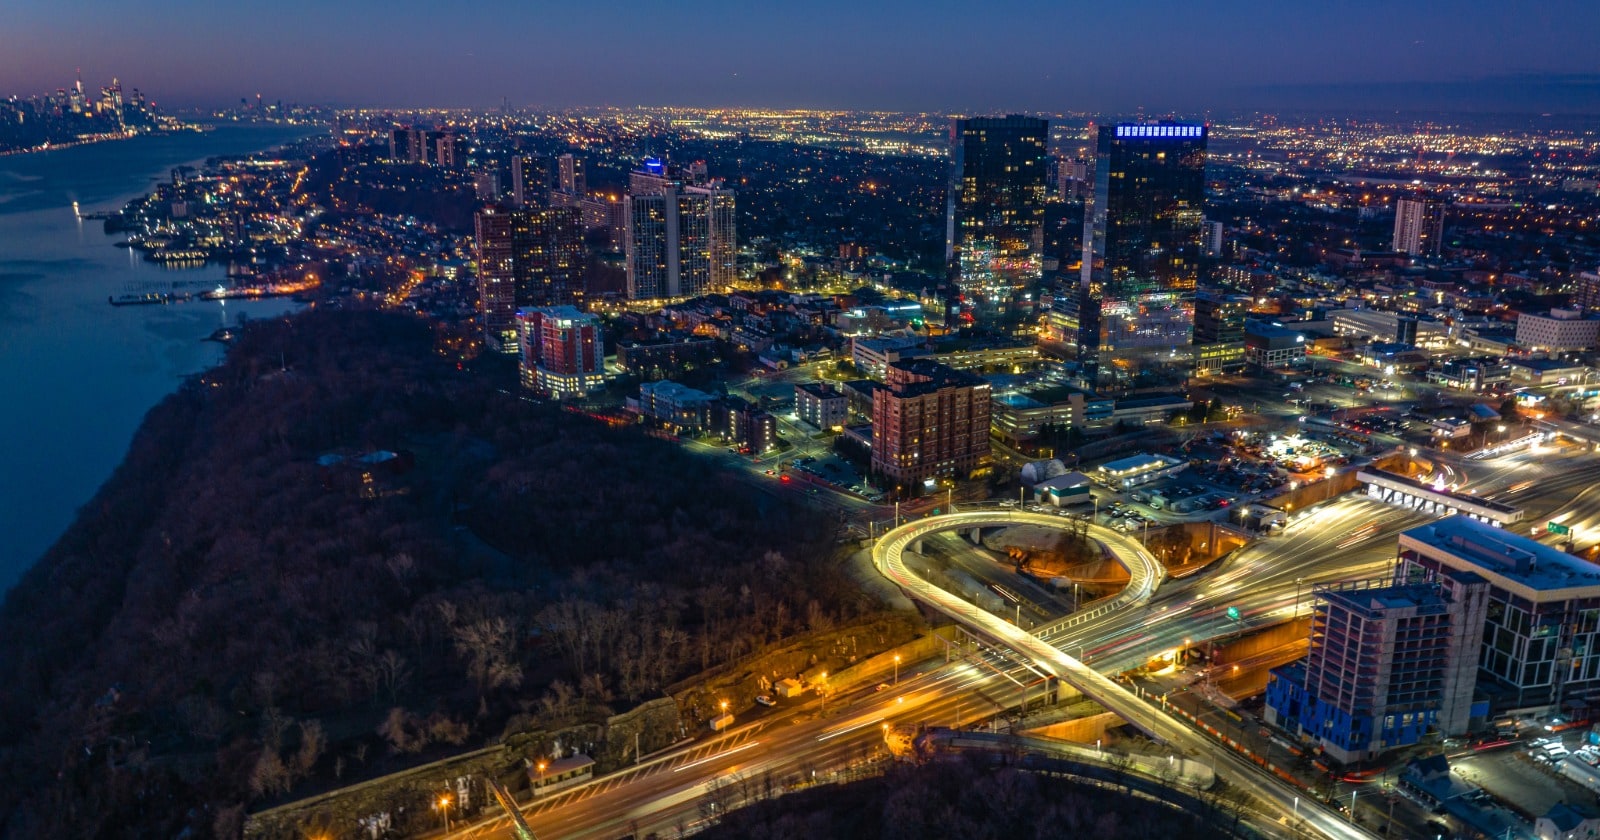
New Jersey fits 1,270.6 people into every square mile. Alaska fits 1.3 people per square mile. New Jersey's density is roughly 985 times Alaska's.
Density is population divided by land area and it tells you whether a state's politics run on highways or subways, whether its housing is detached or stacked, and how far the average person lives from a hospital.
| State | People per square mile | Population |
|---|---|---|
| District of Columbia | 11,168.8 | 681,294 |
| New Jersey | 1,270.6 | 9,343,809 |
| Rhode Island | 1,065.6 | 1,101,801 |
| Massachusetts | 903.1 | 7,044,056 |
| Connecticut | 748.6 | 3,624,508 |
| Maryland | 639.3 | 6,206,011 |
| Delaware | 524.0 | 1,021,191 |
| New York | 421.3 | 19,852,366 |
| Florida | 418.0 | 22,416,077 |
| Pennsylvania | 291.0 | 13,018,639 |
The District of Columbia is in a class of its own because it is a city, not a state. Among states, the top of the list is the Northeast corridor, unbroken from Maryland to Massachusetts, with one Southern exception: Florida, which is now denser than Pennsylvania.
The empty end
Alaska has 1.29 people per square mile, less than a quarter of Wyoming's 6.00. Montana follows at 7.67, North Dakota at 11.37, and South Dakota at 11.97. New Mexico is at 17.48, Idaho at 23.41, and Nebraska at 25.76.
Alaska's figure reflects an area larger than Texas, California, and Montana combined, holding fewer people than Fort Worth.
What has changed since 1990
Density moves slowly, since land area is fixed and only the numerator changes. Over 34 years the shifts still add up.
| State | 1990 | 2024 | Change |
|---|---|---|---|
| Nevada | 10.9 | 29.0 | +166% |
| Utah | 21.0 | 41.3 | +97% |
| Texas | 65.0 | 115.6 | +78% |
| Florida | 241.3 | 418.0 | +73% |
| California | 191.0 | 252.2 | +32% |
| Wyoming | 4.7 | 6.0 | +28% |
| New Jersey | 1,051.2 | 1,270.6 | +21% |
| Rhode Island | 970.5 | 1,065.6 | +10% |
Nevada nearly tripled, and Utah roughly doubled, but both started so low that they are still emptier than the average Eastern state. Florida added 177 people per square mile, the largest absolute gain in the country, which is the arithmetic behind three decades of Florida development stories.
A state figure averages over everything inside it, including the empty parts, so it understates how most residents actually live. Nevada is thinly settled on paper while roughly three out of four Nevadans live in one metro area. For the places people actually crowd into, see the most densely populated cities in America and the most extreme census tracts. Population counts are at which state has the largest population, and the full list is at the most densely populated states.
Sources
Density is population divided by land area in square miles, excluding water. Population comes from the U.S. Census Bureau's 2020-2024 American Community Survey 5-year estimates for 2024 figures and the 1990 decennial census for the earlier ones; land area comes from the Census Bureau's TIGER files. Because land area excludes lakes, bays, and rivers, states with large water areas such as Michigan and Florida rank higher here than they would on total-area figures.
Add CensusEasy as a preferred source on Google to see our stories first.
 GENERAL
Lottery ticket sales nearly doubled to $104.7 billion, and states now keep 33 cents of each dollar
State lottery sales rose from $52.8 billion in fiscal 2008 to $104.7 billion in 2024, Census data show. Prizes grew 118 percent, so states kept 33 percent of sales, down from 39 percent.
 GENERAL
The fastest-gentrifying places in America are small towns, not big cities
Triana, Alabama, went from 499 residents to 3,964 in a decade, and its bachelor's share nearly doubled. Across 6,646 places, 11 of the 12 fastest-gentrifying are towns under 20,000 people.
 GENERAL
Business applications hit a September record, and hiring plans ticked up for the first time this year
Americans filed 534,947 business applications in September, the most for any September since 2004. Applications with planned wages rose for the first time in 2026, and Missouri jumped 22.1 percent.
What is the most densely populated state?
New Jersey, at 1,270.6 people per square mile, followed by Rhode Island at 1,065.6 and Massachusetts at 903.1. The District of Columbia is far denser at 11,168.8, but it is a city rather than a state.
What is the least densely populated state?
Alaska, at 1.29 people per square mile, less than a quarter of Wyoming's 6.00. Montana follows at 7.67, North Dakota at 11.37, and South Dakota at 11.97. Alaska's land area is larger than Texas, California, and Montana combined.
Which state's density grew the most since 1990?
Nevada rose the most in percentage terms, from 10.9 to 29.0 people per square mile, and Utah roughly doubled from 21.0 to 41.3. In absolute terms Florida gained the most, adding about 177 people per square mile to reach 418.0.