
The most common birthplace of immigrants in every state
Mexico is the top birthplace of immigrants in 32 states. India leads in four, Cuba in Florida, and in six states the top spot is a statistical tie.
See more of our coverage in your search results.
Mexico is the most common birthplace of immigrants in 32 states, according to 2020-2024 American Community Survey estimates from the U.S. Census Bureau. India is first in four states, and El Salvador, Canada, and the Dominican Republic each lead in three, counting the District of Columbia as a state.
Nationwide, 10.9 million of the country's 47.3 million immigrants were born in Mexico, or 23.1 percent. India is a distant second at 2.9 million. The Census Bureau counts as foreign-born anyone who was not a U.S. citizen at birth, so the totals include naturalized citizens.
Mexico's share is largest in the Southwest. In New Mexico, 64.6 percent of immigrants were born in Mexico, the highest share for a single country in any state. Arizona, at 51.5 percent, is the only other state where one country accounts for more than half. Idaho (47.9 percent) and Texas (45.5 percent) are next.
Florida's top birthplace is Cuba, with 1.06 million residents. That is more people than the Mexican-born population of any state except California and Texas. Cuba accounts for 21.6 percent of Florida's 4.9 million immigrants, and Haiti is second.
The Dominican Republic is first in New York, with 490,874 residents, and in Rhode Island. El Salvador leads in Maryland, Virginia, and the District of Columbia. Canada is first in three states on the northern border, Maine, Montana, and Vermont, and the Philippines leads in Hawaii and Alaska. Jamaica is first in Connecticut, Honduras in Louisiana, and Brazil in Massachusetts.
India's four states are New Jersey, Ohio, Michigan, and New Hampshire. New Jersey has the most India-born residents of the four, 279,421, or 12.5 percent of the state's immigrants. India is also the second most common birthplace in 19 other states, among them Texas, Illinois, Georgia, and Washington.
In six states the top spot is a statistical tie. Every American Community Survey figure is an estimate with a margin of error, and in these states the gap between first and second place is smaller than the margin of error for that difference. In Michigan, India (81,249) leads Mexico (80,898) by 351 people. In Pennsylvania, the Dominican Republic (102,698) leads India (102,281) by 417. Massachusetts (Brazil over the Dominican Republic), New Hampshire (India over Canada), North Dakota (Mexico over the Philippines), and West Virginia (Mexico over India) are also too close to separate.
No single country dominates in Connecticut. Its top birthplace, Jamaica, accounts for 8.1 percent of the state's 569,177 immigrants, the smallest leading share in any state. In Massachusetts, the top three, Brazil, the Dominican Republic, and China, each account for between 8.1 and 8.8 percent.
The top birthplace in every state
States are ranked by number of immigrants. An asterisk marks a top birthplace whose lead over second place is within the survey's margin of error.
| Rank | State | Immigrants | Top birthplace | Share of immigrants | Second | Third |
|---|---|---|---|---|---|---|
| 1 | California | 10,598,272 | Mexico | 36.5% | Philippines | China |
| 2 | Texas | 5,302,466 | Mexico | 45.5% | India | El Salvador |
| 3 | Florida | 4,905,608 | Cuba | 21.6% | Haiti | Colombia |
| 4 | New York | 4,525,937 | Dominican Republic | 10.8% | China | Jamaica |
| 5 | New Jersey | 2,236,554 | India | 12.5% | Dominican Republic | Mexico |
| 6 | Illinois | 1,872,449 | Mexico | 34.4% | India | Poland |
| 7 | Massachusetts | 1,271,206 | Brazil* | 8.8% | Dominican Republic | China |
| 8 | Georgia | 1,222,749 | Mexico | 19.1% | India | Jamaica |
| 9 | Washington | 1,206,843 | Mexico | 20.6% | India | China |
| 10 | Virginia | 1,142,826 | El Salvador | 9.7% | India | Mexico |
| 11 | Maryland | 1,030,605 | El Salvador | 12.9% | India | Nigeria |
| 12 | Pennsylvania | 1,004,975 | Dominican Republic* | 10.2% | India | China |
| 13 | North Carolina | 973,325 | Mexico | 23.7% | India | Honduras |
| 14 | Arizona | 957,784 | Mexico | 51.5% | India | Canada |
| 15 | Michigan | 728,881 | India* | 11.1% | Mexico | Iraq |
| 16 | Ohio | 616,061 | India | 11.0% | Mexico | China |
| 17 | Nevada | 609,066 | Mexico | 35.2% | Philippines | El Salvador |
| 18 | Colorado | 576,653 | Mexico | 37.1% | India | China |
| 19 | Connecticut | 569,177 | Jamaica | 8.1% | India | Dominican Republic |
| 20 | Minnesota | 497,719 | Mexico | 12.7% | Somalia | India |
| 21 | Tennessee | 431,545 | Mexico | 22.6% | Guatemala | Honduras |
| 22 | Indiana | 431,255 | Mexico | 26.6% | India | China |
| 23 | Oregon | 418,367 | Mexico | 34.2% | Vietnam | India |
| 24 | Wisconsin | 306,979 | Mexico | 29.5% | India | China |
| 25 | South Carolina | 305,101 | Mexico | 21.7% | India | Colombia |
| 26 | Utah | 302,552 | Mexico | 34.6% | Venezuela | Peru |
| 27 | Missouri | 277,967 | Mexico | 15.9% | India | China |
| 28 | Hawaii | 259,001 | Philippines | 43.5% | Japan | China |
| 29 | Oklahoma | 256,215 | Mexico | 41.3% | Vietnam | Guatemala |
| 30 | Louisiana | 224,537 | Honduras | 22.8% | Mexico | Vietnam |
| 31 | Kansas | 216,817 | Mexico | 39.1% | India | Vietnam |
| 32 | Kentucky | 211,210 | Mexico | 16.3% | Cuba | India |
| 33 | Alabama | 203,578 | Mexico | 27.7% | Guatemala | Korea |
| 34 | New Mexico | 199,738 | Mexico | 64.6% | Philippines | Germany |
| 35 | Iowa | 189,988 | Mexico | 23.6% | India | Guatemala |
| 36 | Rhode Island | 168,502 | Dominican Republic | 21.4% | Guatemala | Portugal |
| 37 | Arkansas | 165,740 | Mexico | 40.1% | El Salvador | India |
| 38 | Nebraska | 159,084 | Mexico | 30.4% | Guatemala | India |
| 39 | Idaho | 114,849 | Mexico | 47.9% | Canada | Philippines |
| 40 | Delaware | 109,282 | Mexico | 13.8% | India | Guatemala |
| 41 | District of Columbia | 97,388 | El Salvador | 11.3% | Ethiopia | Mexico |
| 42 | New Hampshire | 85,632 | India* | 8.9% | Canada | Dominican Republic |
| 43 | Mississippi | 71,918 | Mexico | 22.9% | Honduras | Guatemala |
| 44 | Alaska | 56,745 | Philippines | 32.2% | Korea | Mexico |
| 45 | Maine | 56,448 | Canada | 18.2% | United Kingdom | China |
| 46 | North Dakota | 36,962 | Mexico* | 9.6% | Philippines | Canada |
| 47 | South Dakota | 35,988 | Mexico | 11.9% | Guatemala | Ethiopia |
| 48 | West Virginia | 32,329 | Mexico* | 8.5% | India | Philippines |
| 49 | Vermont | 27,669 | Canada | 15.5% | United Kingdom | India |
| 50 | Montana | 25,679 | Canada | 15.6% | Mexico | Philippines |
| 51 | Wyoming | 20,494 | Mexico | 38.5% | Canada | Philippines |
West Virginia has the smallest immigrant share of any state, 1.8 percent of residents. Its top three birthplaces, Mexico (2,757), India (2,296), and the Philippines (2,200), are separated by 557 people.
Add CensusEasy as a preferred source on Google to see our work first.
What is the most common country of birth for immigrants in the U.S.?
Mexico. About 10.9 million U.S. residents were born there, 23.1 percent of the 47.3 million immigrants in the 2020-2024 American Community Survey. India is second, with about 2.9 million.
In which states is India the top birthplace for immigrants?
New Jersey, Ohio, Michigan, and New Hampshire. New Jersey has the most, 279,421 India-born residents. In Michigan and New Hampshire, India's lead over the next country is within the survey's margin of error.
Which state has the highest share of immigrants from one country?
New Mexico. Mexico accounts for 64.6 percent of its 199,738 immigrants, the highest share for a single country in any state. Arizona, at 51.5 percent, is the only other state above half.
Immigrant counts come from table B05006, Place of Birth for the Foreign-Born Population in the United States, in the American Community Survey 2020-2024 5-year estimates. The Census Bureau classifies as foreign-born anyone who was not a U.S. citizen at birth, including naturalized citizens. Each country's share of a state's immigrants is its count divided by the state's total foreign-born population in the same table. The immigrant share of each state's population uses total population from table B01003.
Countries are ranked among the 125 individual countries and areas listed in B05006. Regional remainder lines such as "Other Eastern Africa" and "Asia, n.e.c." are not single countries and are excluded. The United Kingdom is counted as a whole, including England and Scotland, Portugal includes the Azores, and the Czech Republic and Slovakia share one line in the table.
A lead is marked as a statistical tie when the difference between the first and second estimates is smaller than the margin of error of that difference, calculated as the square root of the sum of the two squared margins of error, at the Census Bureau's 90 percent confidence level. Puerto Rico is not included.
You may cite or republish these findings, and the downloadable dataset is licensed under CC BY 4.0. Reuse requires that you credit CensusEasy and link back to this page so readers can verify the underlying data.
CensusEasy Data Team (2026). "The most common birthplace of immigrants in every state." CensusEasy. Retrieved from https://censuseasy.com/studies/most-common-birthplace-of-immigrants-by-state
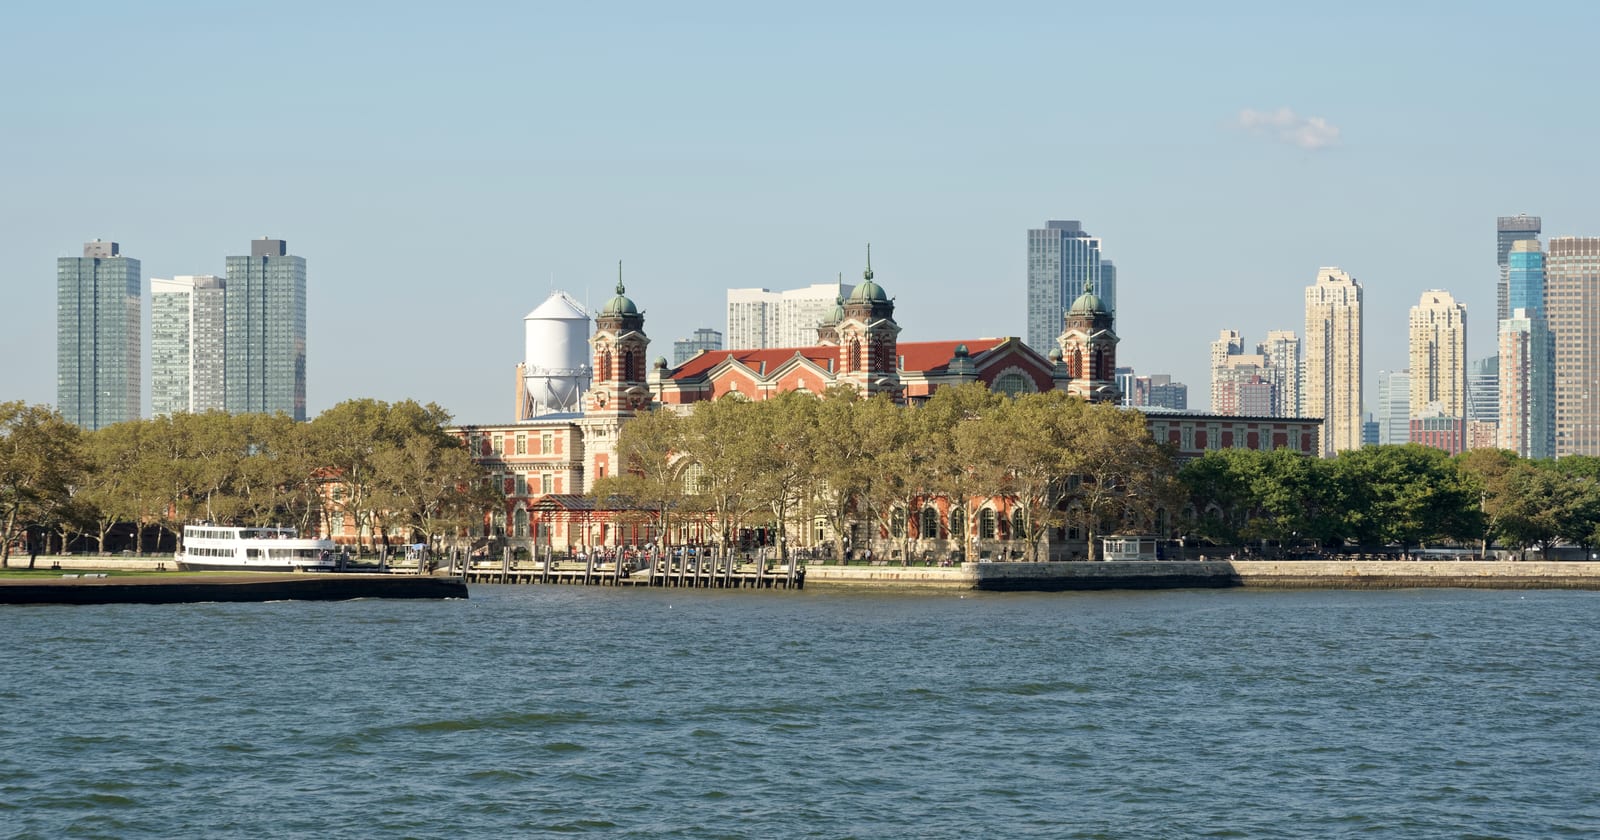
U.S. Census Bureau, American Community Survey 2020-2024 5-year estimates, table B05006 (place of birth for the foreign-born population in the United States), including margins of error, and table B01003 (total population). Each country's full city, county, metro, and state rankings are on the immigrants by country of birth pages. Photo: Ellis Island with Jersey City in the background, by Jakub Hałun, via Wikimedia Commons, licensed CC BY 4.0, cropped to fit.

CensusEasy publishes original research grounded in US Census Bureau data. Every study includes the underlying numbers, methodology, and sources so readers can verify or extend the analysis.
Data note. Figures in this report are derived from US Census Bureau and Bureau of Labor Statistics data, including American Community Survey estimates that carry sampling margins of error. This information is provided as is, for general informational purposes, without warranty of accuracy or completeness. CensusEasy is not affiliated with or endorsed by the US Census Bureau or any government agency. See our Terms of Use for details.