New home sales rose in August as July's slump shrank on revision
See more of our coverage in your search results.
New single-family homes sold at a seasonally adjusted annual rate of 684,000 in August, up 6.4 percent from July, the Census Bureau and the Department of Housing and Urban Development reported September 24. Sales were 2.0 percent below August 2025.
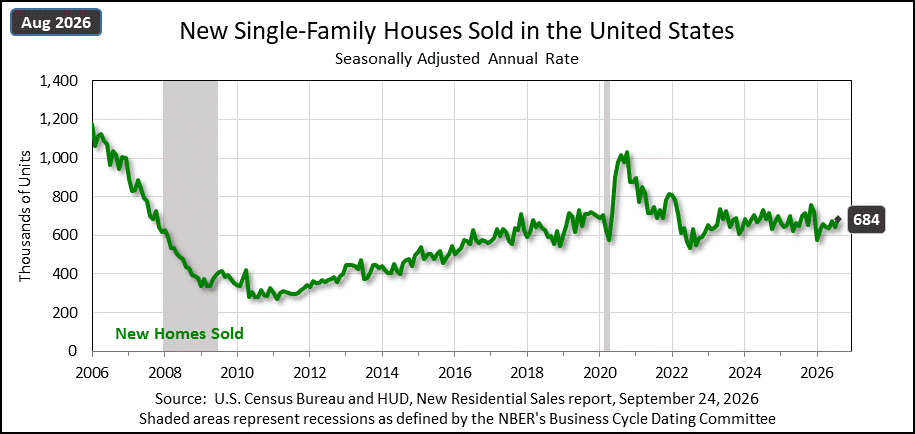
The margin of error on the monthly gain is plus or minus 19.5 percentage points, and on the yearly decline it is plus or minus 15.7, so the true change in each case could be up or down.
The bigger shift was in last month's number. July sales were first reported at 607,000, a 10.5 percent drop from June (see our coverage of the July report). The revised July figure is 643,000, about 4 percent below a revised June. Most of the July slump is gone.
Most of the revision came in the South, where July sales were first put at 383,000 and now stand at 422,000. The Midwest went from 43,000 to 53,000. In August the Midwest jumped to 98,000, an 84.9 percent increase. That is one of three changes in the release large enough to clear its margin of error.
| Figure | Change | Margin | Significant? |
|---|---|---|---|
| Midwest sales, vs. July | +84.9% | ±51.2 | Yes |
| West sales, vs. August 2025 | −26.8% | ±22.9 | Yes |
| Average price, vs. August 2025 | −8.8% | ±7.7 | Yes |
| US sales, vs. July | +6.4% | ±19.5 | No |
| US sales, vs. August 2025 | −2.0% | ±15.7 | No |
| Northeast sales, vs. July | −36.1% | ±36.9 | No |
| Median price, vs. August 2025 | −5.8% | ±8.2 | No |
| Homes for sale, vs. August 2025 | −2.0% | ±4.0 | No |
The West went the other direction. Sales there ran at 112,000, down from 153,000 a year earlier, a 26.8 percent drop. The South remained the largest market by far at 451,000, about two of every three new homes sold.
Prices eased. The median new home sold for $393,700, nearly flat from July's $392,200 and 5.8 percent below August 2025's $417,900. The average price fell to $478,700, down 8.8 percent from $525,100 a year earlier. The average runs higher than the median because a smaller number of expensive homes pulls it up.
For comparison, the median value of all owner-occupied homes in the country was $360,600 in the 2024 American Community Survey. That figure is based on what owners think their homes are worth, so it measures something different, but it puts the typical new home about 9 percent above the typical existing one. State-by-state figures are in our median home value by state rankings.
Supply held steady. There were 483,000 new homes for sale at the end of August, the same as in July, equal to 8.5 months of supply at the current sales pace. That was down from 9.0 months in July and the same as a year earlier.
From January through August, builders sold an estimated 449,600 new homes, compared with 463,200 in the same months of 2025. That 2.9 percent decline is also within the margin of error.
August's figures are preliminary and will be revised next month, as July's were.
Sources
Sales, inventory, and price figures, along with their 90 percent confidence intervals, are from the U.S. Census Bureau and Department of Housing and Urban Development's Monthly New Residential Sales, August 2026 (Release CB26-155, September 24, 2026) and its accompanying data tables. Sales figures are seasonally adjusted annual rates except the year-to-date totals, which are not seasonally adjusted. The median value of owner-occupied homes is from the 2024 American Community Survey 1-year estimates, table B25077.
Add CensusEasy as a preferred source on Google to see our stories first.
 GENERAL
Detroit has the highest unemployment rate among large US cities
Among big cities, unemployment runs from 14.0 percent in Detroit to 2.5 percent in Sioux Falls. California's farm counties carry the highest county rates in the country.
 GENERAL
The largest city in every state
The biggest city in one state can be 190 times the size of the biggest in another. New York tops the list at 8.6 million; Vermont's largest, Burlington, has 44,019. The most populous city in all 50 states and DC.
 GENERAL
Illinois population: 12.7 million people, and only 18 counties still growing
Illinois had 12,719,141 residents in 2025, down about 93,000 since the 2020 census. Cook County is shrinking while Kendall County, southwest of Chicago, grew 10 percent.
How many new homes sold in August 2026?
New single-family homes sold at a seasonally adjusted annual rate of 684,000 in August 2026, up 6.4 percent from July and 2.0 percent below August 2025. Neither change is statistically significant.
What was the median price of a new home in August 2026?
The median new home sold for $393,700, nearly flat from July's $392,200 and 5.8 percent below the $417,900 of August 2025. The average price was $478,700, down 8.8 percent from a year earlier.
Why did the July new home sales number change?
Monthly figures are preliminary and get revised as more sales records come in. July was first reported at 607,000 and revised to 643,000, shrinking its drop from June from 10.5 percent to about 4 percent.