Factory orders edged up in August as business equipment orders rose 1.6%
See more of our coverage in your search results.
New orders for manufactured goods rose $0.7 billion, or 0.1 percent, to $663.5 billion in August, the U.S. Census Bureau reported October 2. It was the second straight monthly gain, after a revised 0.8 percent increase in July.
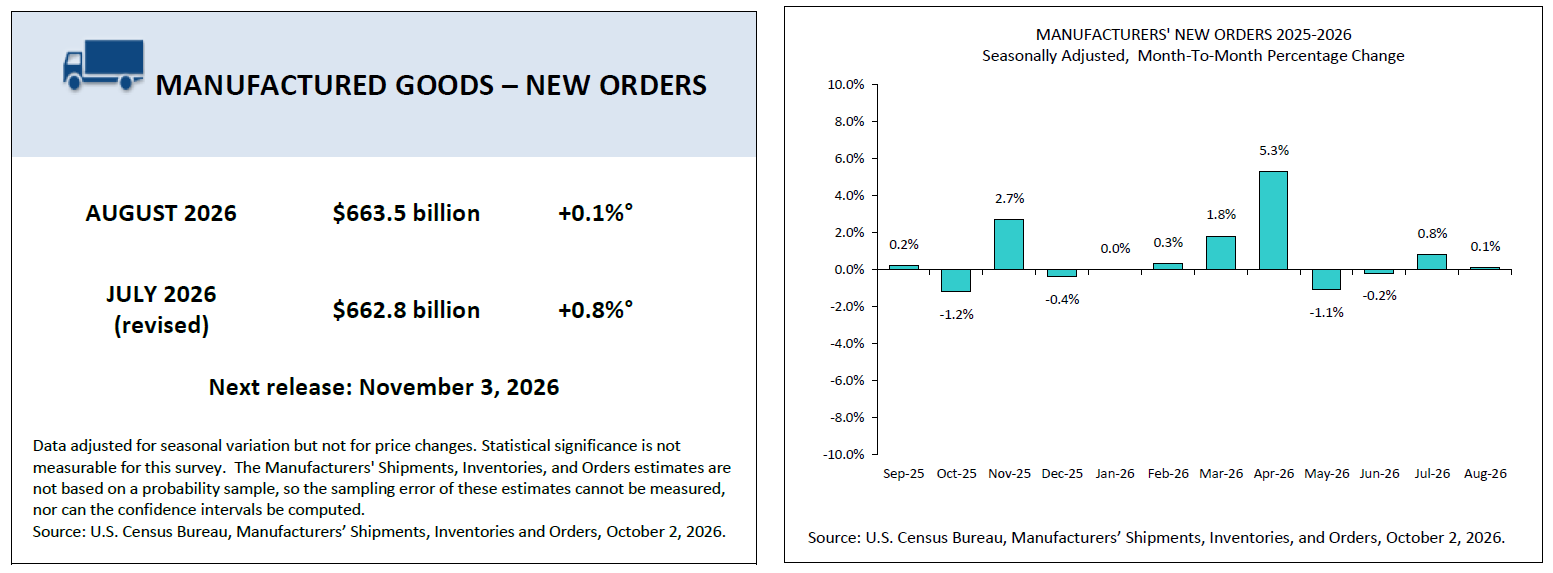
Shipments were essentially flat at $658.6 billion, ending a run of eight straight monthly increases. Inventories rose 0.5 percent to $972.4 billion, their 11th consecutive gain, and the backlog of unfilled orders grew 0.6 percent to $1,609.6 billion. The backlog has risen in 25 of the last 26 months.
Unlike most Census Bureau indicators, this survey is not based on a probability sample, so the bureau cannot measure its sampling error or say whether a monthly change is statistically significant.
Business equipment orders rose
Orders for nondefense capital goods excluding aircraft, often used as a gauge of business equipment investment, rose 1.6 percent to $87.6 billion. Shipments in the same category rose 0.5 percent to $85.0 billion.
Aircraft pulled the other way. Orders for nondefense aircraft and parts fell 4.3 percent to $18.8 billion, which left durable goods orders down 0.1 percent at $338.5 billion. Excluding transportation, total new orders rose 0.3 percent. Through August, unadjusted nondefense aircraft orders were 22.1 percent below the same months of 2025.
| Rank | Industry | August new orders | Change from July |
|---|---|---|---|
| 1 | Mining, oil field, and gas field machinery | $1.9B | +9.5% |
| 2 | Construction machinery | $5.0B | +7.2% |
| 3 | Defense aircraft and parts | $6.1B | +5.9% |
| 4 | Turbines, generators, and power transmission equipment | $5.7B | +3.5% |
| 5 | Aluminum and nonferrous metals | $12.9B | +1.7% |
| 6 | Motor vehicle bodies, parts, and trailers | $33.8B | +0.8% |
| 7 | Fabricated metal products | $45.0B | −1.4% |
| 8 | Ships and boats | $6.1B | −2.7% |
| 9 | Nondefense aircraft and parts | $18.8B | −4.3% |
| 10 | Industrial machinery | $5.2B | −7.5% |
The backlog is mostly airplanes and defense
Of the $956.8 billion in unfilled orders for nondefense capital goods, about two-thirds, $639.9 billion, is aircraft and parts. The rest, $316.9 billion, is everything else, from machinery to computers. Defense capital goods carry another $229.5 billion in unfilled orders, up 11.7 percent from August 2025 on an unadjusted basis.
Defense orders have been the fastest-growing piece this year. Through August, unadjusted orders for defense capital goods totaled $156.2 billion, 41.8 percent more than the $110.2 billion in the same months of 2025. Across all manufacturing, year-to-date orders were up 6.8 percent, to $5.18 trillion. Those figures are not adjusted for inflation.
The gain in turbine and generator orders fits the power buildout in the bureau's construction data, where power construction is the largest nonresidential category, as covered in August's construction spending report. The backlog trend was the focus of our June factory orders coverage, and the earlier durable goods report showed the same aircraft swings.
The September report is scheduled for November 3.
Sources
Figures are from the U.S. Census Bureau's Full Report on Manufacturers' Shipments, Inventories, and Orders for August 2026 (CB26-150, released October 2, 2026) and its data tables, including Table 2 (new orders by industry) and Table 5 (topical series, including capital goods). Monthly figures are seasonally adjusted; year-to-date and year-over-year comparisons use not seasonally adjusted data. Dollar amounts are not adjusted for price changes. New orders exclude the semiconductor industry, for which the bureau does not collect order data.
Add CensusEasy as a preferred source on Google to see our stories first.
 GENERAL
Black household income rises 76% since 1967, but dollar gap with White households widens
Census figures back to 1967 show Black median household income up 76.2 percent after inflation, to $59,980. The ratio to non-Hispanic White income narrowed, but the gap in dollars grew to $36,730.
 GENERAL
These U.S. counties have the highest housing vacancy rates, but they're not abandoned
Sixty-one percent of housing in Summit County, Colorado is vacant. That's Breckenridge, not a ghost town. Every county at the top of the vacancy list is a vacation destination.
 GENERAL
The area codes with the most people
Hawaii's 808 is the most populous area code covering a whole state, with 1.43 million residents. Arizona averages 1.5 million people per code. Here is every state's area codes and residents per code.
How much were factory orders in August 2026?
New orders for manufactured goods were $663.5 billion in August 2026, up $0.7 billion, or 0.1 percent, from July, according to the Census Bureau. It was the second straight monthly increase, following a 0.8 percent gain in July.
What are core capital goods orders?
They are orders for nondefense capital goods excluding aircraft, a measure of business spending on equipment such as machinery and computers. In August 2026 they rose 1.6 percent to $87.6 billion, while shipments in the category rose 0.5 percent.
How big is the manufacturing order backlog?
Unfilled orders reached $1,609.6 billion in August 2026, up 0.6 percent from July and up in 25 of the last 26 months. About two-thirds of the nondefense capital goods backlog is aircraft and parts.