Construction spending rose in August as office building closed in on factories
See more of our coverage in your search results.
Construction spending ran at a seasonally adjusted annual rate of $2,203.1 billion in August, the U.S. Census Bureau reported October 1. That is 0.9 percent above the revised July figure of $2,184.5 billion, a gain the bureau says is not statistically significant. Spending was 1.7 percent below August 2025, a decline that is.
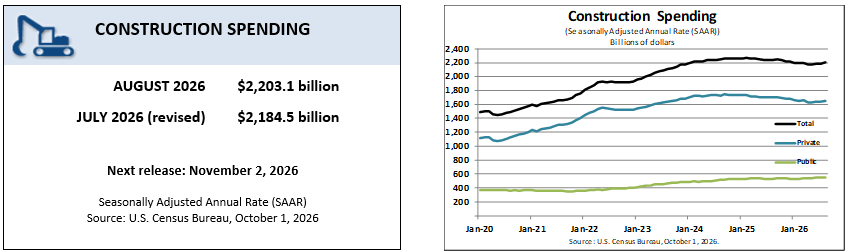
Through the first eight months of the year, spending totaled $1,450.4 billion, 3.1 percent less than the $1,496.6 billion spent in the same months of 2025.
The bigger change was to July. The bureau first put July spending at $2,157.6 billion. The revised figure is $2,184.5 billion, $26.9 billion higher. Nearly all of that came from residential construction, which was revised from $859.0 billion to $885.0 billion.
Office building keeps closing in on factories
Office construction, the category where the bureau counts data centers, reached $150.7 billion in August, up 3.9 percent from July and 24.6 percent from a year earlier. Manufacturing construction was $170.7 billion, down 19.2 percent from August 2025.
A year ago, factory building ran $90.2 billion ahead of office building at annual rates. In August the gap was $20.0 billion. Private office construction alone rose 29.8 percent over the year, from $103.3 billion to $134.1 billion.
| Rank | Category | August 2026 | Change from August 2025 |
|---|---|---|---|
| 1 | Conservation and development | $16.7B | +29.6% |
| 2 | Office | $150.7B | +24.6% |
| 3 | Religious | $6.9B | +18.3% |
| 4 | Power | $186.0B | +8.5% |
| 5 | Highway and street | $152.2B | +4.6% |
| 6 | Residential | $894.6B | −4.8% |
| 7 | Commercial | $122.8B | −5.4% |
| 8 | Public safety | $21.6B | −7.1% |
| 9 | Lodging | $24.9B | −10.0% |
| 10 | Manufacturing | $170.7B | −19.2% |
Power construction, at $186.0 billion, is the largest nonresidential category and is up 8.5 percent from a year ago. The bureau's category definitions list data centers under office and exclude the racks and servers inside them, so the office figure covers the buildings and their fixed systems, not the computing equipment.
Private spending rose; housing was flat
Private construction rose 1.1 percent in August to $1,655.3 billion, a statistically significant gain. Private nonresidential spending was up 1.0 percent, to $773.0 billion. Private residential spending rose 1.1 percent to $882.3 billion, but that change falls within the margin of error. New single-family construction was nearly unchanged at $403.3 billion and is down 3.5 percent from a year earlier.
Public construction was $547.8 billion, up 0.2 percent for the month, which is not statistically significant, and up 2.5 percent from August 2025. Public highway spending was $150.6 billion and public educational construction $113.1 billion, both essentially flat from July.
The office and factory trend has been building for months. It was the main story in July's construction report and showed up earlier in the fading factory boom. On the housing side, the August new home sales report showed sales up but within the margin of error.
The September report is scheduled for November 2.
Sources
Figures are from the U.S. Census Bureau's Monthly Construction Spending report for August 2026 (CB26-158, released October 1, 2026) and its Table 1 data, seasonally adjusted annual rates in current dollars, not adjusted for inflation. The first July estimate is from the bureau's September 1, 2026, release. Statistical significance is as reported by the bureau at the 90 percent confidence level. Category definitions, including the treatment of data centers, are from the bureau's construction category definitions.
Add CensusEasy as a preferred source on Google to see our stories first.
 GENERAL
Black household income rises 76% since 1967, but dollar gap with White households widens
Census figures back to 1967 show Black median household income up 76.2 percent after inflation, to $59,980. The ratio to non-Hispanic White income narrowed, but the gap in dollars grew to $36,730.
 GENERAL
These U.S. counties have the highest housing vacancy rates, but they're not abandoned
Sixty-one percent of housing in Summit County, Colorado is vacant. That's Breckenridge, not a ghost town. Every county at the top of the vacancy list is a vacation destination.
 GENERAL
The area codes with the most people
Hawaii's 808 is the most populous area code covering a whole state, with 1.43 million residents. Arizona averages 1.5 million people per code. Here is every state's area codes and residents per code.
How much was US construction spending in August 2026?
Construction spending ran at a seasonally adjusted annual rate of $2,203.1 billion in August 2026, according to the Census Bureau. That was 0.9 percent above July, a change that is not statistically significant, and 1.7 percent below August 2025.
Is construction spending up or down in 2026?
Down. Through the first eight months of 2026, construction spending totaled $1,450.4 billion, 3.1 percent less than the $1,496.6 billion in the same months of 2025. Manufacturing and residential construction are both below last year.
Does construction spending include data centers?
Yes. The Census Bureau counts data centers in its office category, which reached $150.7 billion in August 2026, up 24.6 percent from a year earlier. The figure covers the buildings and their fixed systems, not the racks and servers inside.