Housing Construction Jumped in June, but Permits Point to a Cooling Single-Family Market
See more of our coverage in your search results.
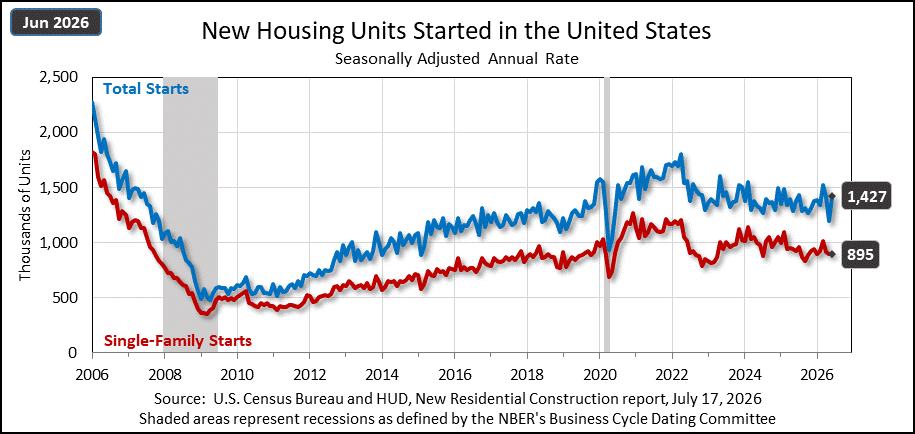
New home construction sent a mixed signal in June 2026. Housing starts jumped 19 percent from May 2026, a big number that led the headlines, but the more reliable and forward-looking measure, building permits, fell. The U.S. Census Bureau and the U.S. Department of Housing and Urban Development released the June figures on July 17, and read together they point less to a building boom than to a volatile multifamily sector masking a cooling single-family market.
The three headline numbers
The report tracks three stages of the construction pipeline, each reported as a seasonally adjusted annual rate.
| Stage | Indicator | June 2026 rate | vs May 2026 | vs June 2025 |
|---|---|---|---|---|
| 1 | Building permits | 1,367,000 | -3.0% | -2.3% |
| 2 | Housing starts | 1,427,000 | +19.0% | +3.5% |
| 3 | Housing completions | 1,392,000 | +3.3% | +1.5% |
Permits come first in the pipeline, a builder pulls one before breaking ground, which makes them the best early read on where construction is heading. They fell 3.0 percent from May and 2.3 percent from a year earlier. Permits are also the firmest figure in the release: they come from a near-complete count rather than a sample, so they carry no sampling margin of error. When the leading indicator is down, the eye-catching jump behind it deserves a closer look.
The starts surge was almost entirely multifamily
That 19 percent jump in starts is real in the statistical sense. Its margin of error is wide, plus or minus 15.9 percent, but even the low end of that range is an increase, so it clears the bar for significance. The catch is where the growth came from. Single-family starts, the bulk of the market and the part most tied to ordinary homebuyers, were essentially flat at 895,000, down 0.2 percent from May, a change too small to distinguish from no change at all. Every bit of the month's gain came from apartments and other multi-unit buildings, where starts are notoriously choppy month to month.
The single-family pipeline tells the clearer story when you line up all three stages for that segment alone.
| Stage | Single-family | June rate | vs May |
|---|---|---|---|
| 1 | Permits | 871,000 | -2.4% |
| 2 | Starts | 895,000 | -0.2% |
| 3 | Completions | 964,000 | +6.6% |
The pattern is a market working through its backlog: single-family completions rose 6.6 percent as builders finished homes started months ago, while new single-family permits and starts softened. Builders are clearing the pipeline faster than they are refilling it.
Why the caution is warranted
Monthly construction data is some of the noisiest the government publishes, and the agencies say so plainly. The Census Bureau cautions that it can take six months of data to establish a real trend in starts or completions, and that a single month's swing is often just statistical irregularity. It shows in the margins: the 3.5 percent year-over-year rise in starts and the gains in completions both have error ranges wide enough to include zero, meaning they are not statistically distinguishable from no change. The negative permit numbers, which carry no sampling error, are the ones to weight.
For homebuyers, the takeaway is that the flow of new single-family homes is not accelerating, which keeps pressure on prices and affordability in the places already stretched thin. We track where that pressure is heaviest and lightest in the most affordable cities to buy a home and the richest counties in America. This national construction series is a different dataset from the American Community Survey housing data behind those rankings, and for the current national housing and population picture you can always start at the U.S. overview.
Sources
All figures are from the joint Monthly New Residential Construction report for June 2026 (release CB26-119) from the U.S. Census Bureau and the U.S. Department of Housing and Urban Development, published July 17, 2026. Rates are seasonally adjusted annual rates; margins of error are 90 percent confidence intervals. The next report is scheduled for August 18, 2026.
Add CensusEasy as a preferred source on Google to see our stories first.
 GENERAL
Black household income rises 76% since 1967, but dollar gap with White households widens
Census figures back to 1967 show Black median household income up 76.2 percent after inflation, to $59,980. The ratio to non-Hispanic White income narrowed, but the gap in dollars grew to $36,730.
 GENERAL
These U.S. counties have the highest housing vacancy rates, but they're not abandoned
Sixty-one percent of housing in Summit County, Colorado is vacant. That's Breckenridge, not a ghost town. Every county at the top of the vacancy list is a vacation destination.
 GENERAL
The area codes with the most people
Hawaii's 808 is the most populous area code covering a whole state, with 1.43 million residents. Arizona averages 1.5 million people per code. Here is every state's area codes and residents per code.
How much did housing starts rise in June 2026?
Privately owned housing starts rose to a seasonally adjusted annual rate of 1,427,000 in June, up 19.0 percent from May and 3.5 percent from June 2025, according to the U.S. Census Bureau and HUD. The monthly increase was statistically significant, but the year-over-year change was not.
Why did housing starts jump but permits fall?
The starts increase was almost entirely in multifamily buildings, where activity is volatile month to month. Single-family starts were flat at 895,000. Building permits, which come first in the construction pipeline and are the best leading indicator, fell 3.0 percent, suggesting the single-family market is cooling rather than accelerating.
Are the monthly new construction numbers reliable?
They are volatile. The Census Bureau cautions it can take about six months of data to establish a trend in starts or completions. Many figures carry wide confidence intervals; the June year-over-year starts gain and the completion gains had ranges that include zero, so they are not statistically significant. Building permits carry no sampling error and are the firmest figure.